MSFT Trading Predictions
1 Day Prediction
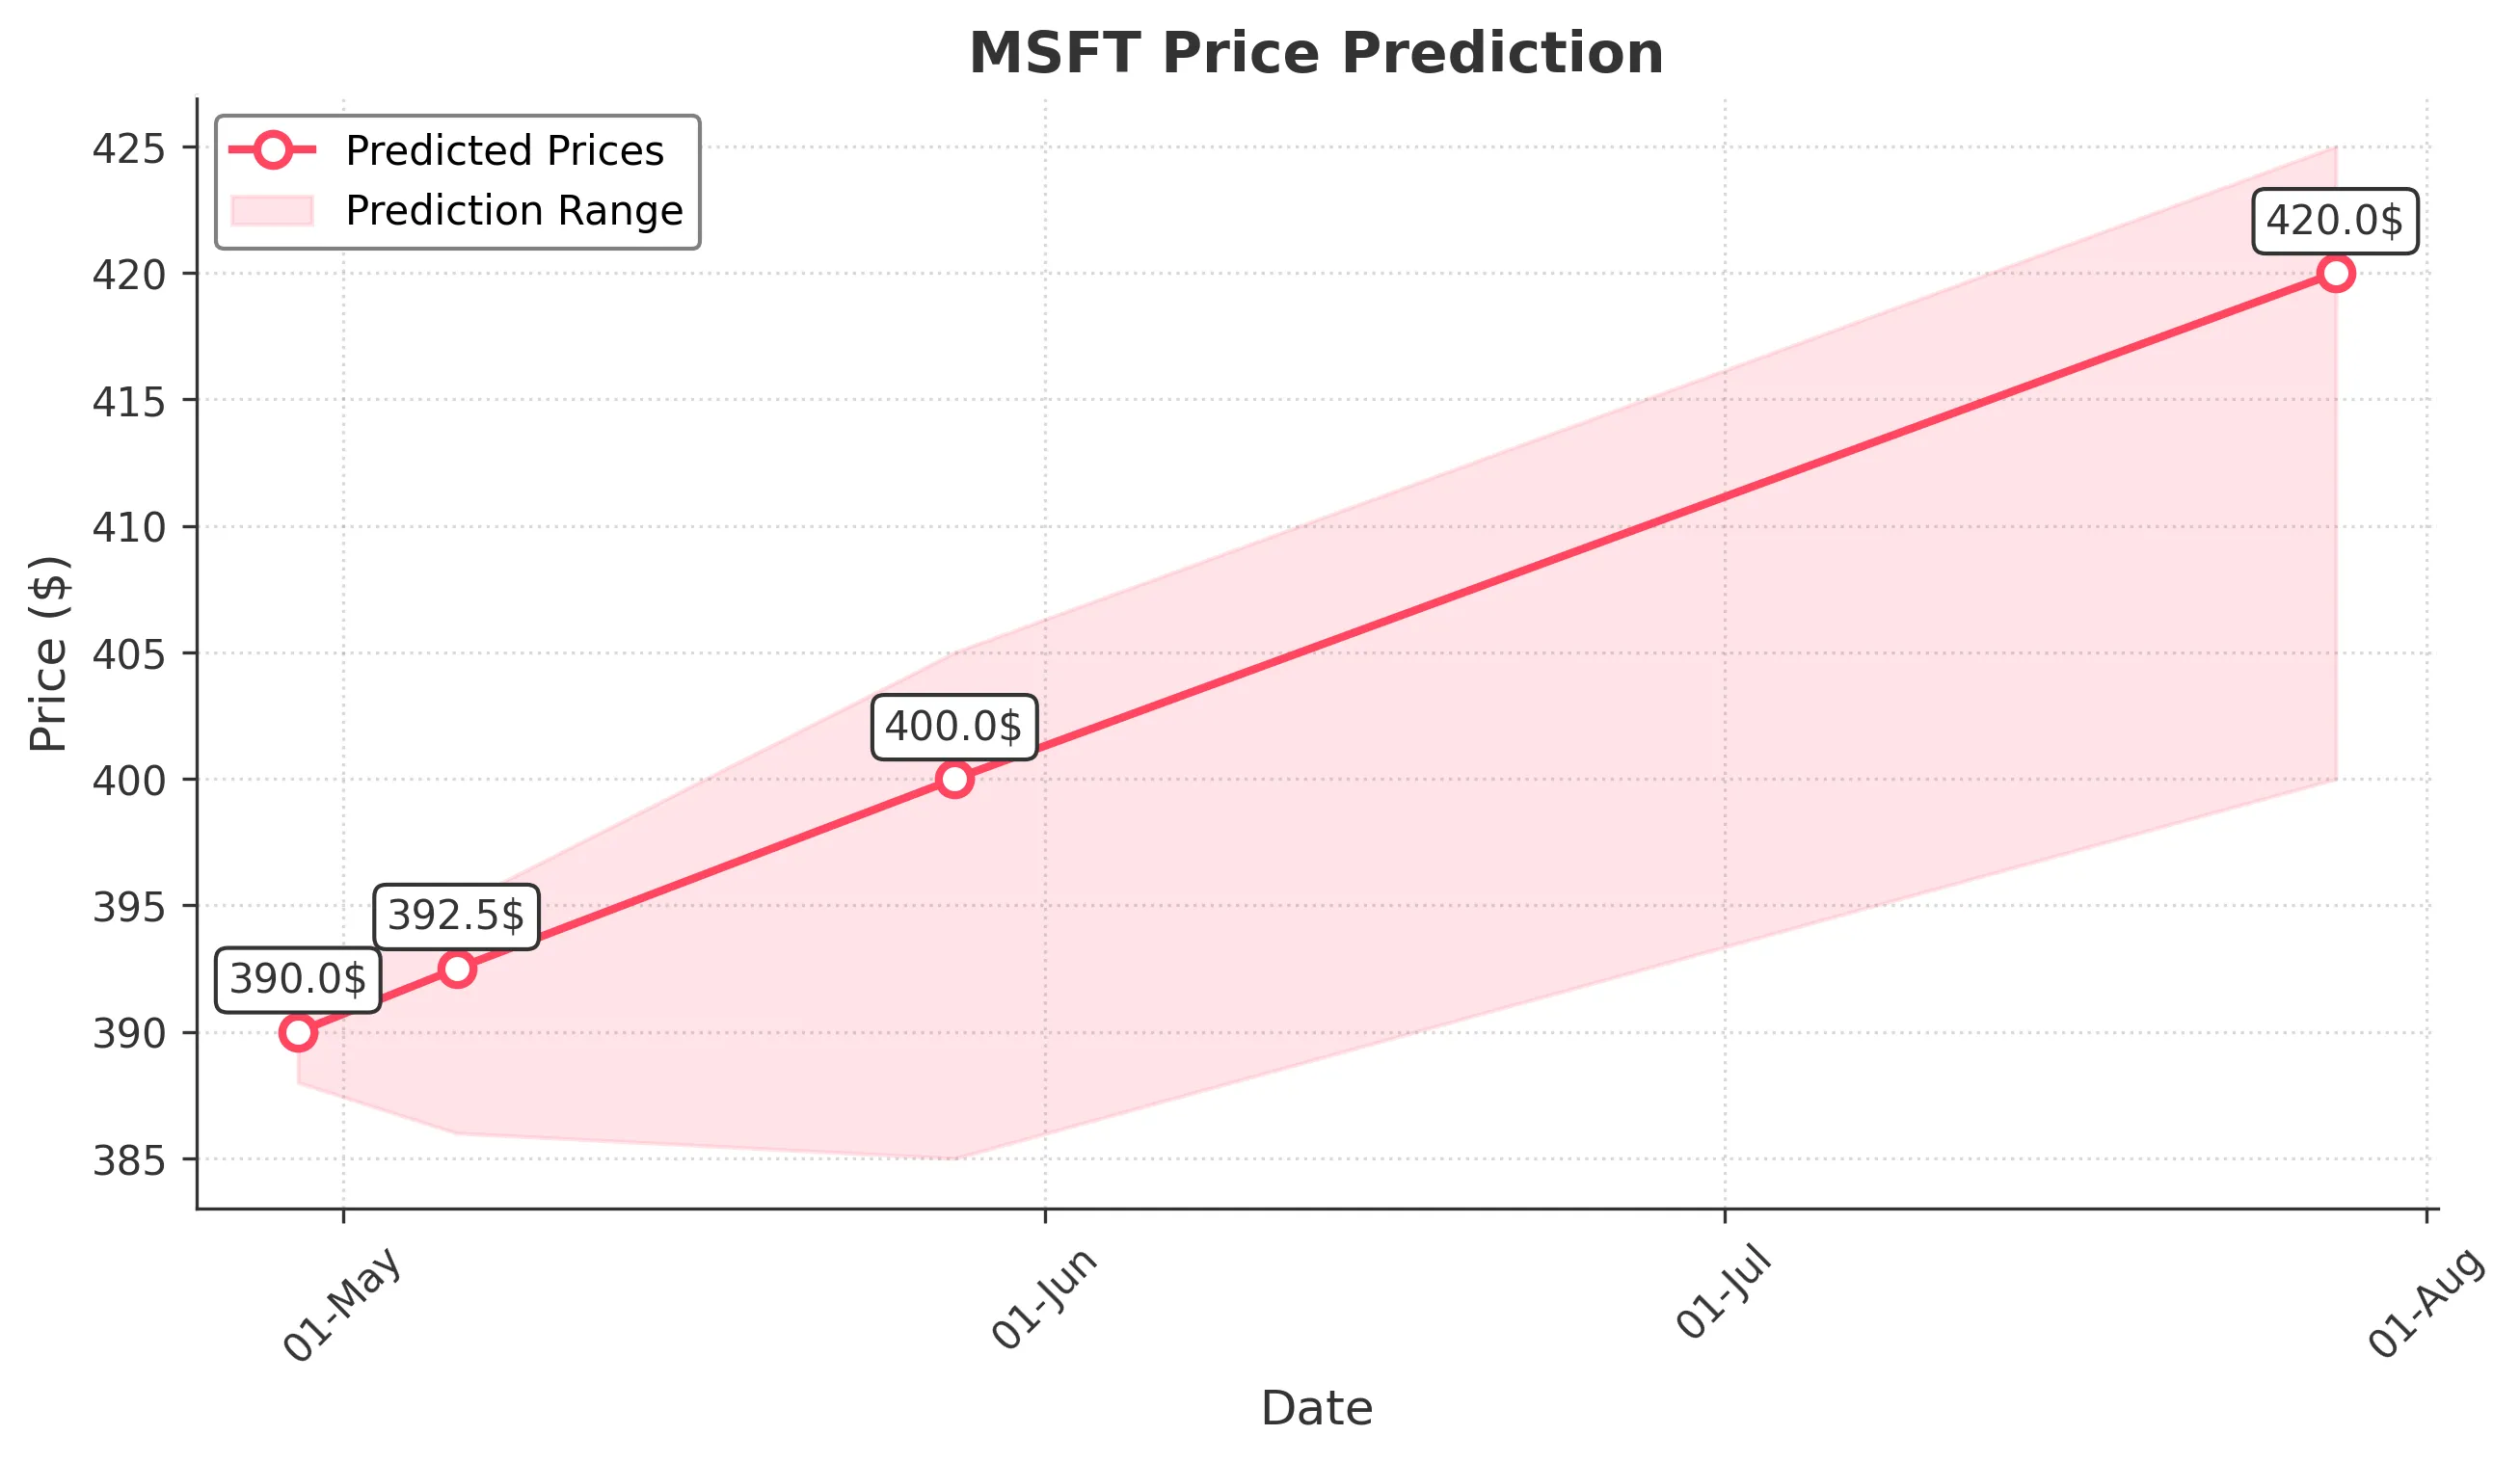
Target: April 29, 2025$390
$389
$392
$388
Description
The stock shows a slight bullish trend with a recent Doji pattern indicating indecision. RSI is neutral, and MACD is close to crossing above the signal line, suggesting potential upward momentum. However, recent volatility and volume spikes indicate caution.
Analysis
Over the past 3 months, MSFT has shown a bearish trend with significant volatility. Key support at $375 and resistance at $400. RSI indicates neutral momentum, while MACD shows potential bullish divergence. Volume patterns suggest increased interest, but external factors could lead to further declines.
Confidence Level
Potential Risks
Market sentiment could shift due to macroeconomic news or earnings reports, which may impact the stock's performance.
1 Week Prediction
Target: May 6, 2025$392.5
$390
$395
$386
Description
The stock is expected to stabilize around $392.50 as it approaches resistance levels. The recent bullish candlestick patterns and a slight uptick in volume suggest a potential rally, but the overall market sentiment remains cautious.
Analysis
MSFT has been fluctuating with a bearish bias recently, but signs of recovery are emerging. Key support at $375 and resistance at $400. Technical indicators show mixed signals, with RSI nearing overbought territory. Volume analysis indicates increased trading activity, suggesting investor interest.
Confidence Level
Potential Risks
Potential for market corrections or negative news could impact the stock's ability to maintain upward momentum.
1 Month Prediction
Target: May 28, 2025$400
$395
$405
$385
Description
A bullish reversal is anticipated as the stock approaches key Fibonacci retracement levels. Positive market sentiment and potential earnings growth could drive prices higher, but caution is warranted due to recent volatility.
Analysis
The stock has shown signs of recovery after a bearish phase, with key support at $375 and resistance at $400. Technical indicators suggest a potential bullish reversal, with RSI improving and MACD showing positive momentum. Volume patterns indicate increased buying interest.
Confidence Level
Potential Risks
Unforeseen macroeconomic events or earnings misses could derail the bullish outlook.
3 Months Prediction
Target: July 28, 2025$420
$410
$425
$400
Description
Long-term bullish sentiment is expected as the stock breaks through resistance levels. Continued positive earnings reports and market conditions could support this upward trend, but external factors may introduce volatility.
Analysis
MSFT has been recovering from a bearish trend, with key support at $375 and resistance at $400. Technical indicators show improving momentum, with RSI moving towards bullish territory. Volume analysis indicates strong buying interest, but market volatility remains a concern.
Confidence Level
Potential Risks
Economic downturns or negative news could impact the stock's performance, leading to potential corrections.