MSFT Trading Predictions
1 Day Prediction
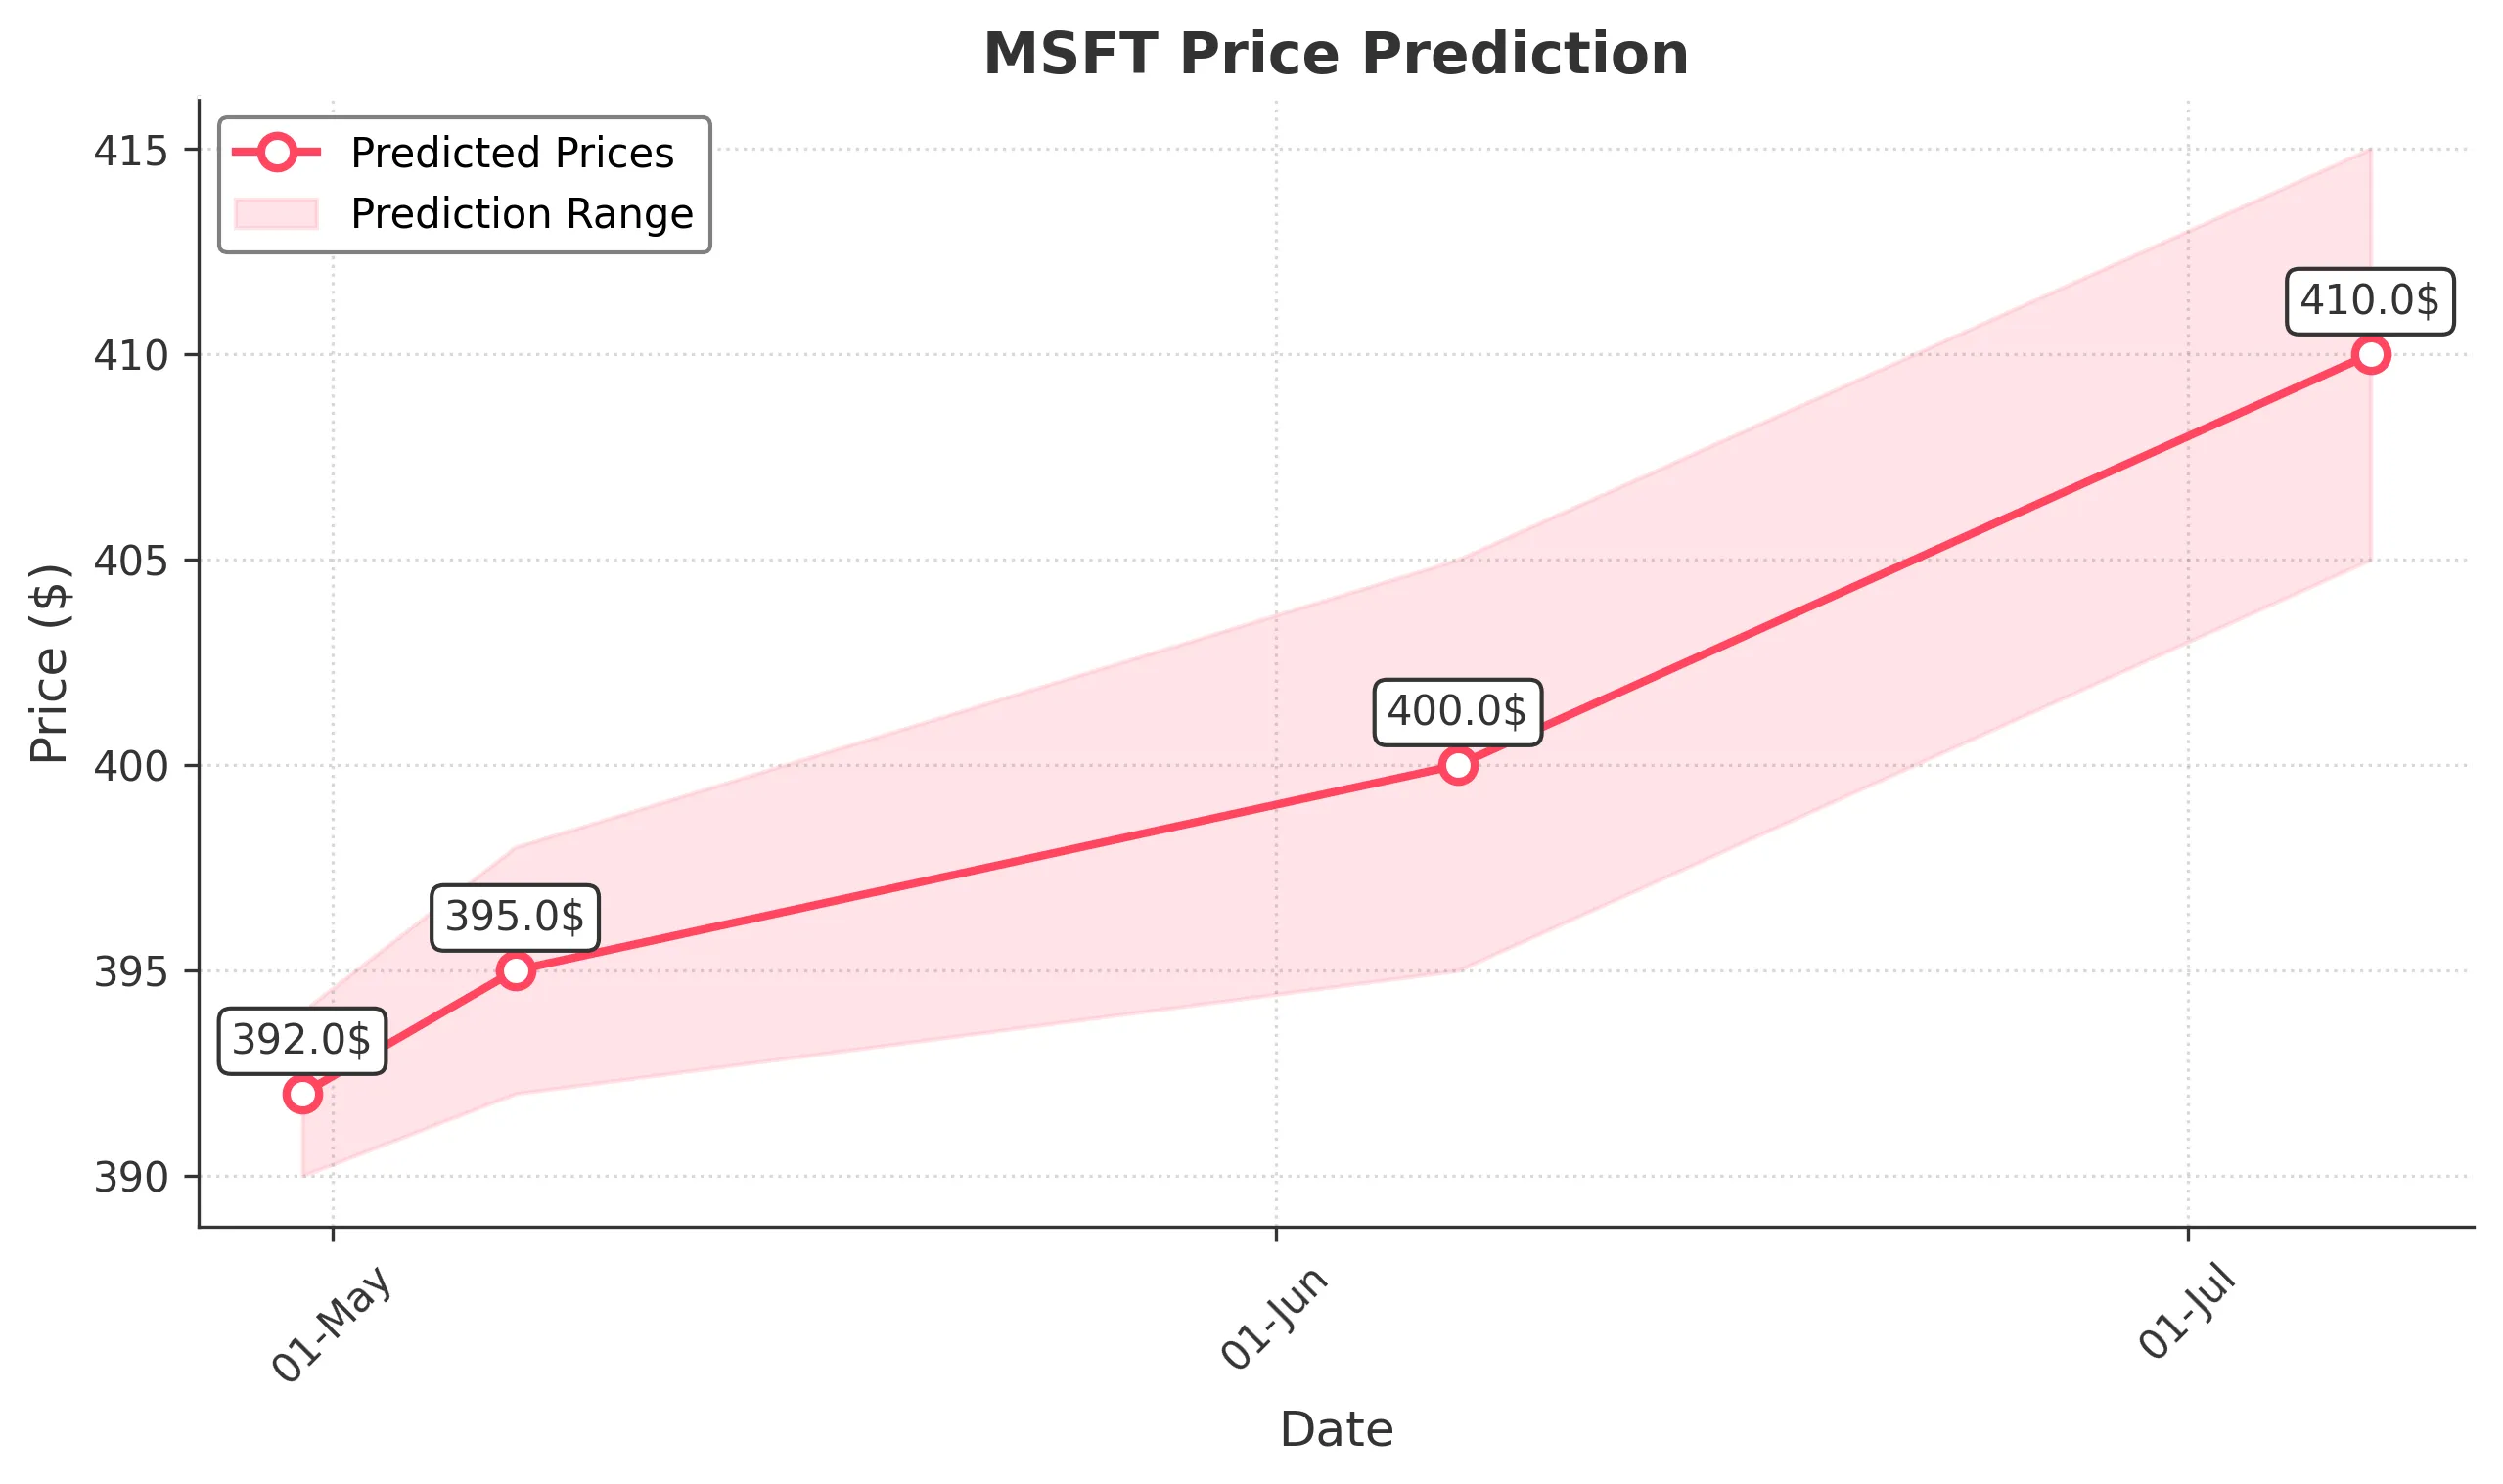
Target: April 30, 2025$392
$391.5
$394
$390
Description
The stock shows a slight bullish trend with a potential close around 392.00. The recent candlestick patterns indicate indecision, but the RSI is neutral, suggesting stability. Volume is expected to decrease slightly, indicating lower trading activity.
Analysis
MSFT has shown a bearish trend over the past month, with significant support around 390.00. The RSI indicates a neutral position, while MACD shows a potential bullish crossover. Volume has been declining, suggesting reduced interest.
Confidence Level
Potential Risks
Market volatility and external news could impact the price unexpectedly.
1 Week Prediction
Target: May 7, 2025$395
$393.5
$398
$392
Description
Expect a slight recovery in MSFT's price to around 395.00 as it approaches resistance levels. The MACD indicates a bullish momentum, while the RSI is approaching overbought territory, suggesting caution.
Analysis
The stock has been fluctuating around key support levels, with recent bullish signals from MACD. However, the overall trend remains uncertain, and external factors could lead to volatility.
Confidence Level
Potential Risks
Potential market corrections or negative news could reverse this trend.
1 Month Prediction
Target: June 7, 2025$400
$396
$405
$395
Description
A gradual upward trend is anticipated, with a close around 400.00. The Fibonacci retracement levels suggest potential resistance at this price. The market sentiment appears cautiously optimistic, but watch for any bearish reversals.
Analysis
MSFT has shown signs of recovery, with key support at 390.00 and resistance at 400.00. The RSI is approaching overbought levels, indicating potential pullbacks. Volume patterns suggest increased interest.
Confidence Level
Potential Risks
Economic indicators and earnings reports could sway market sentiment significantly.
3 Months Prediction
Target: July 7, 2025$410
$408
$415
$405
Description
Long-term outlook suggests a bullish trend with a close around 410.00. The MACD indicates sustained upward momentum, while the RSI may stabilize. However, external economic factors could introduce volatility.
Analysis
Over the past three months, MSFT has experienced a bearish trend with significant fluctuations. Key support is at 390.00, while resistance is at 400.00. The overall market sentiment is mixed, influenced by macroeconomic conditions.
Confidence Level
Potential Risks
Unforeseen macroeconomic events could impact the stock's performance significantly.