MSFT Trading Predictions
1 Day Prediction
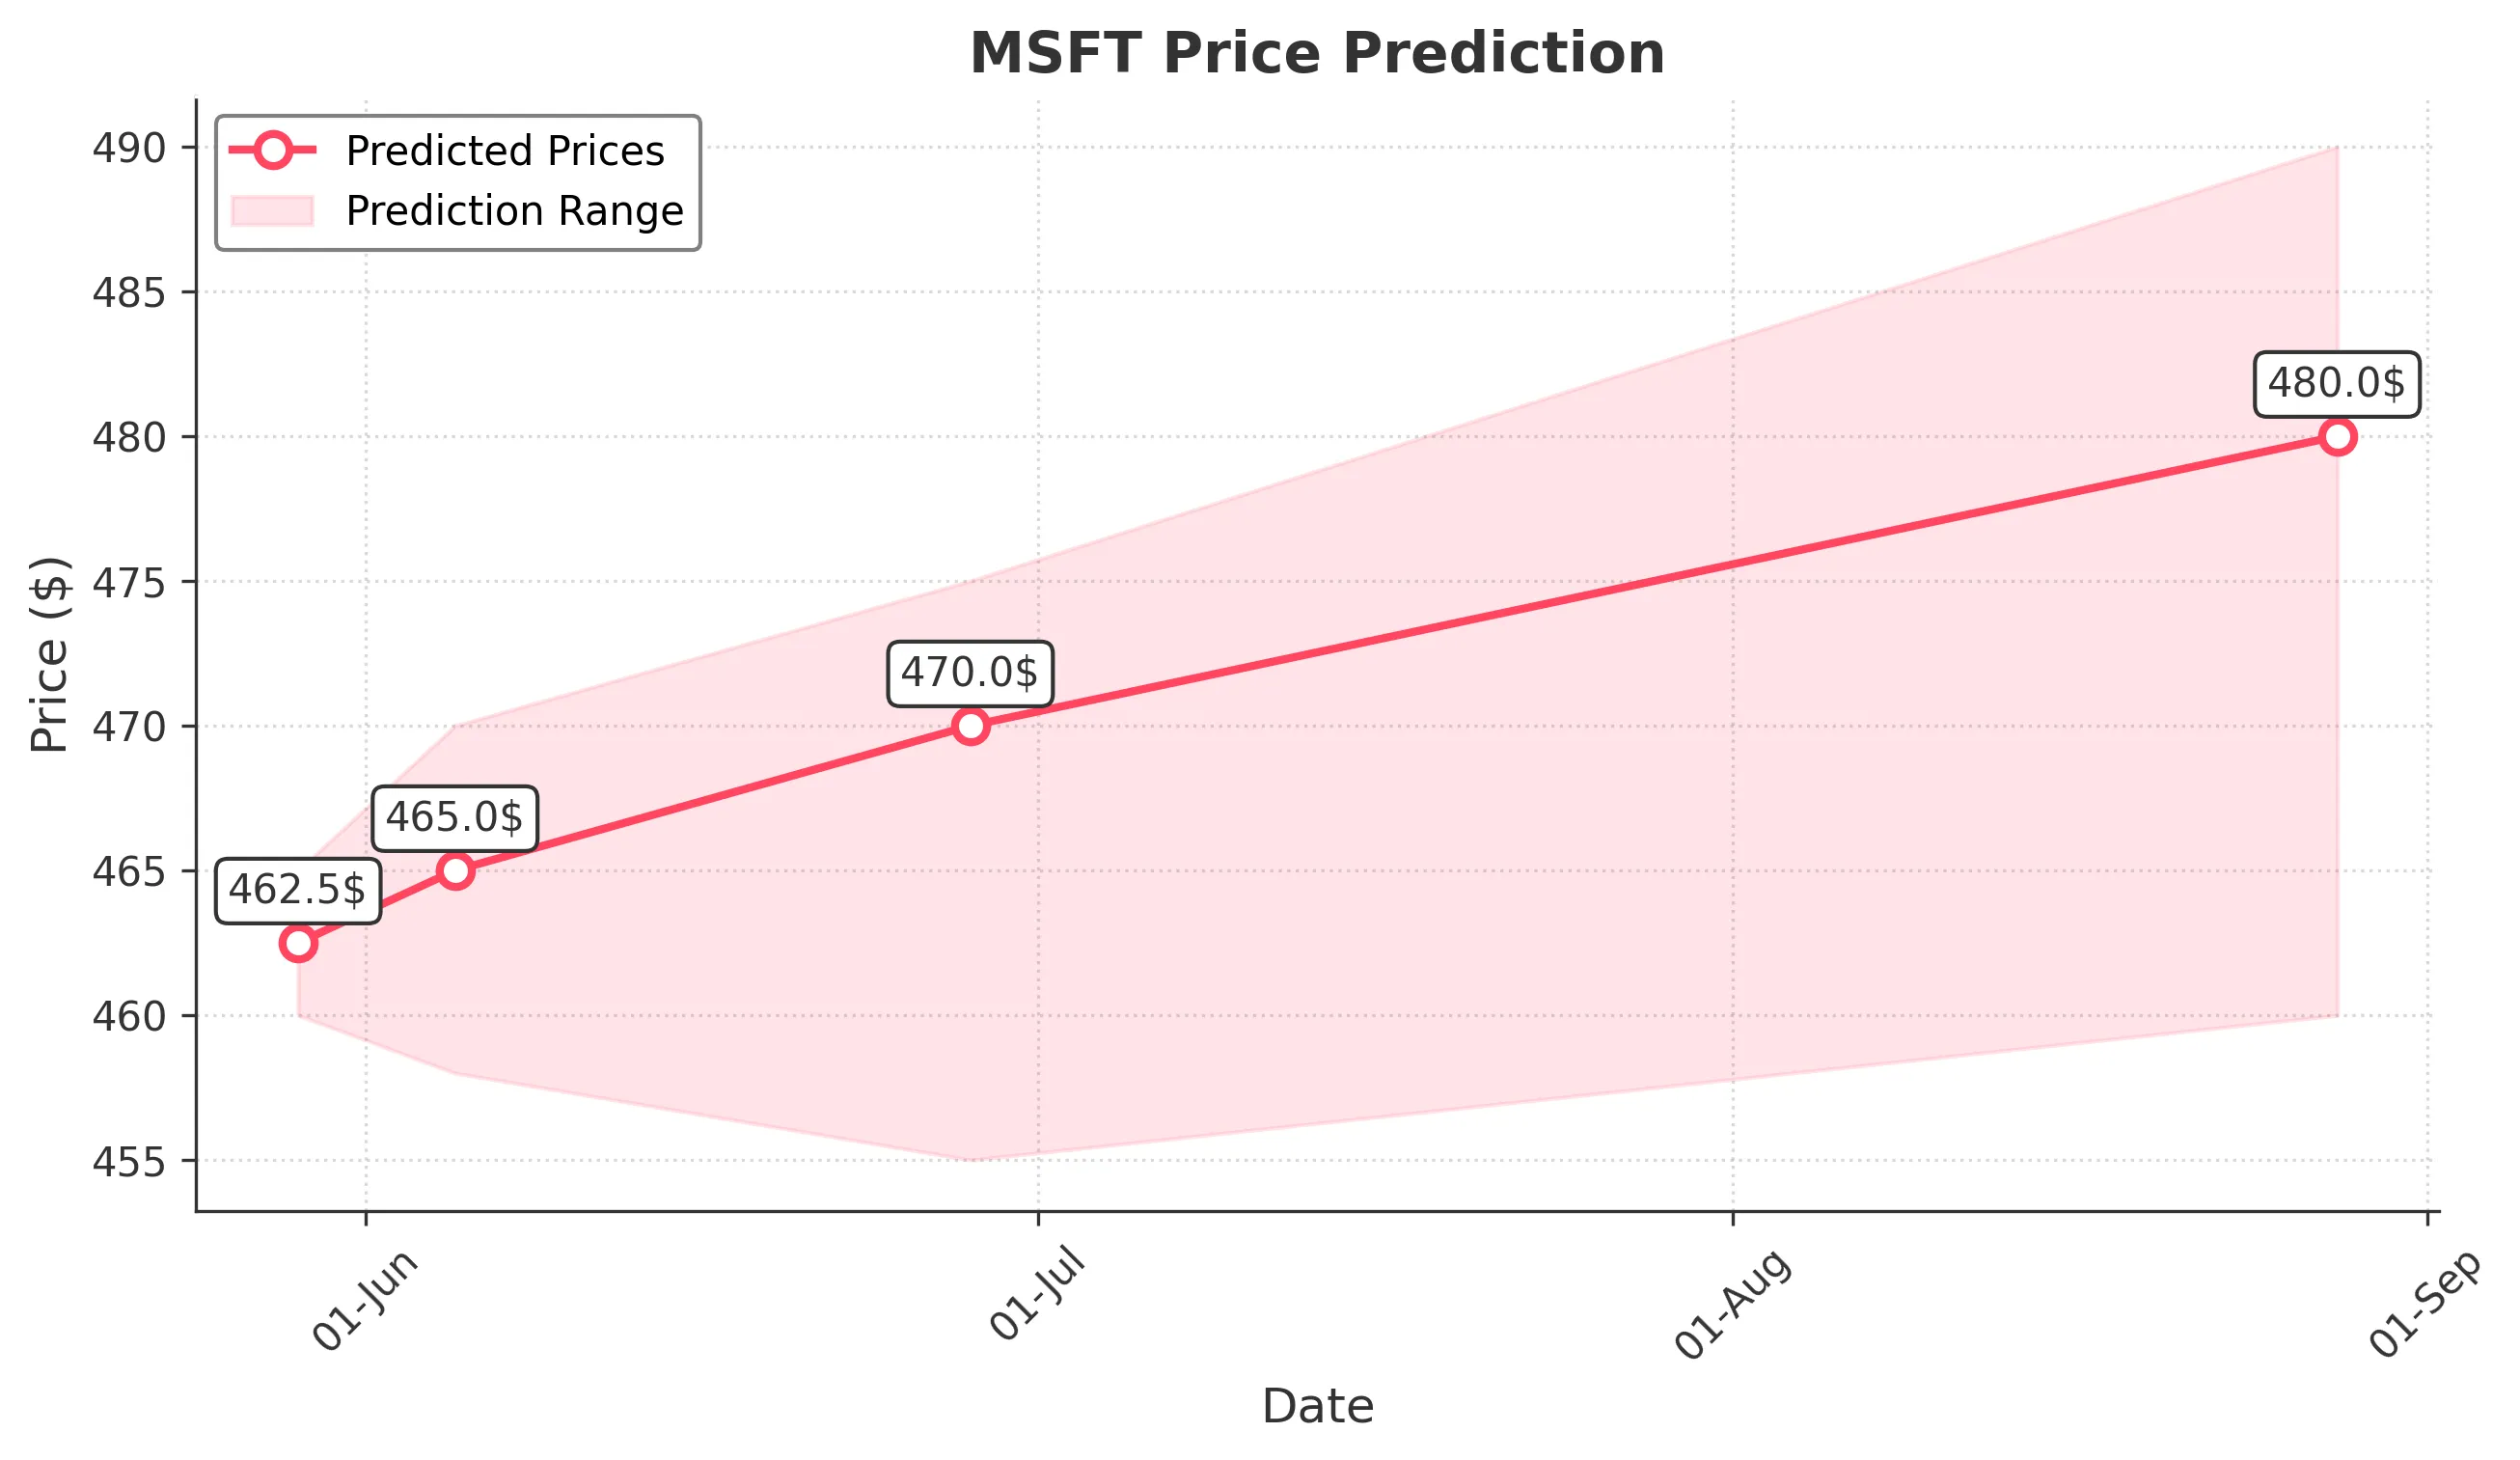
Target: May 29, 2025$462.5
$461.5
$465
$460
Description
The stock shows bullish momentum with a recent close above the 20-day moving average. RSI is near 70, indicating overbought conditions, but MACD remains positive. Expect slight profit-taking, but overall upward pressure persists.
Analysis
MSFT has shown a strong bullish trend over the past three months, with significant support at $450 and resistance around $460. Volume has been increasing, indicating strong buying interest. Recent candlestick patterns suggest continuation, but overbought conditions may lead to short-term corrections.
Confidence Level
Potential Risks
Potential for a pullback due to overbought RSI levels and profit-taking. Market sentiment could shift with external news.
1 Week Prediction
Target: June 5, 2025$465
$462.5
$470
$458
Description
The bullish trend is expected to continue, supported by strong earnings sentiment and positive market conditions. However, the RSI indicates potential overbought territory, suggesting a possible pullback.
Analysis
The stock has maintained a bullish trend, with key support at $450 and resistance at $470. Technical indicators like MACD and moving averages support upward momentum, but the high RSI suggests caution. Volume patterns indicate strong interest, but potential profit-taking could create volatility.
Confidence Level
Potential Risks
Market volatility and external economic factors could impact performance. Watch for any negative news that could trigger a reversal.
1 Month Prediction
Target: June 28, 2025$470
$465
$475
$455
Description
Continued bullish sentiment is expected, driven by strong fundamentals and market trends. However, the stock may face resistance at $475, and profit-taking could lead to short-term corrections.
Analysis
MSFT has shown a strong upward trajectory, with significant support at $450 and resistance at $475. The stock's performance is bolstered by positive earnings reports and market sentiment. However, the potential for volatility exists due to external economic factors and profit-taking.
Confidence Level
Potential Risks
Economic indicators and potential market corrections could affect the stock's performance. Watch for changes in market sentiment.
3 Months Prediction
Target: August 28, 2025$480
$470
$490
$460
Description
Long-term bullish outlook supported by strong fundamentals and market trends. However, potential economic downturns or market corrections could impact growth.
Analysis
Over the past three months, MSFT has demonstrated a strong bullish trend, with key support at $450 and resistance at $490. Technical indicators suggest continued upward momentum, but external economic factors could introduce volatility. The stock's performance is closely tied to broader market trends and investor sentiment.
Confidence Level
Potential Risks
Unforeseen macroeconomic events or shifts in market sentiment could lead to volatility. Watch for changes in economic indicators.