MSFT Trading Predictions
1 Day Prediction
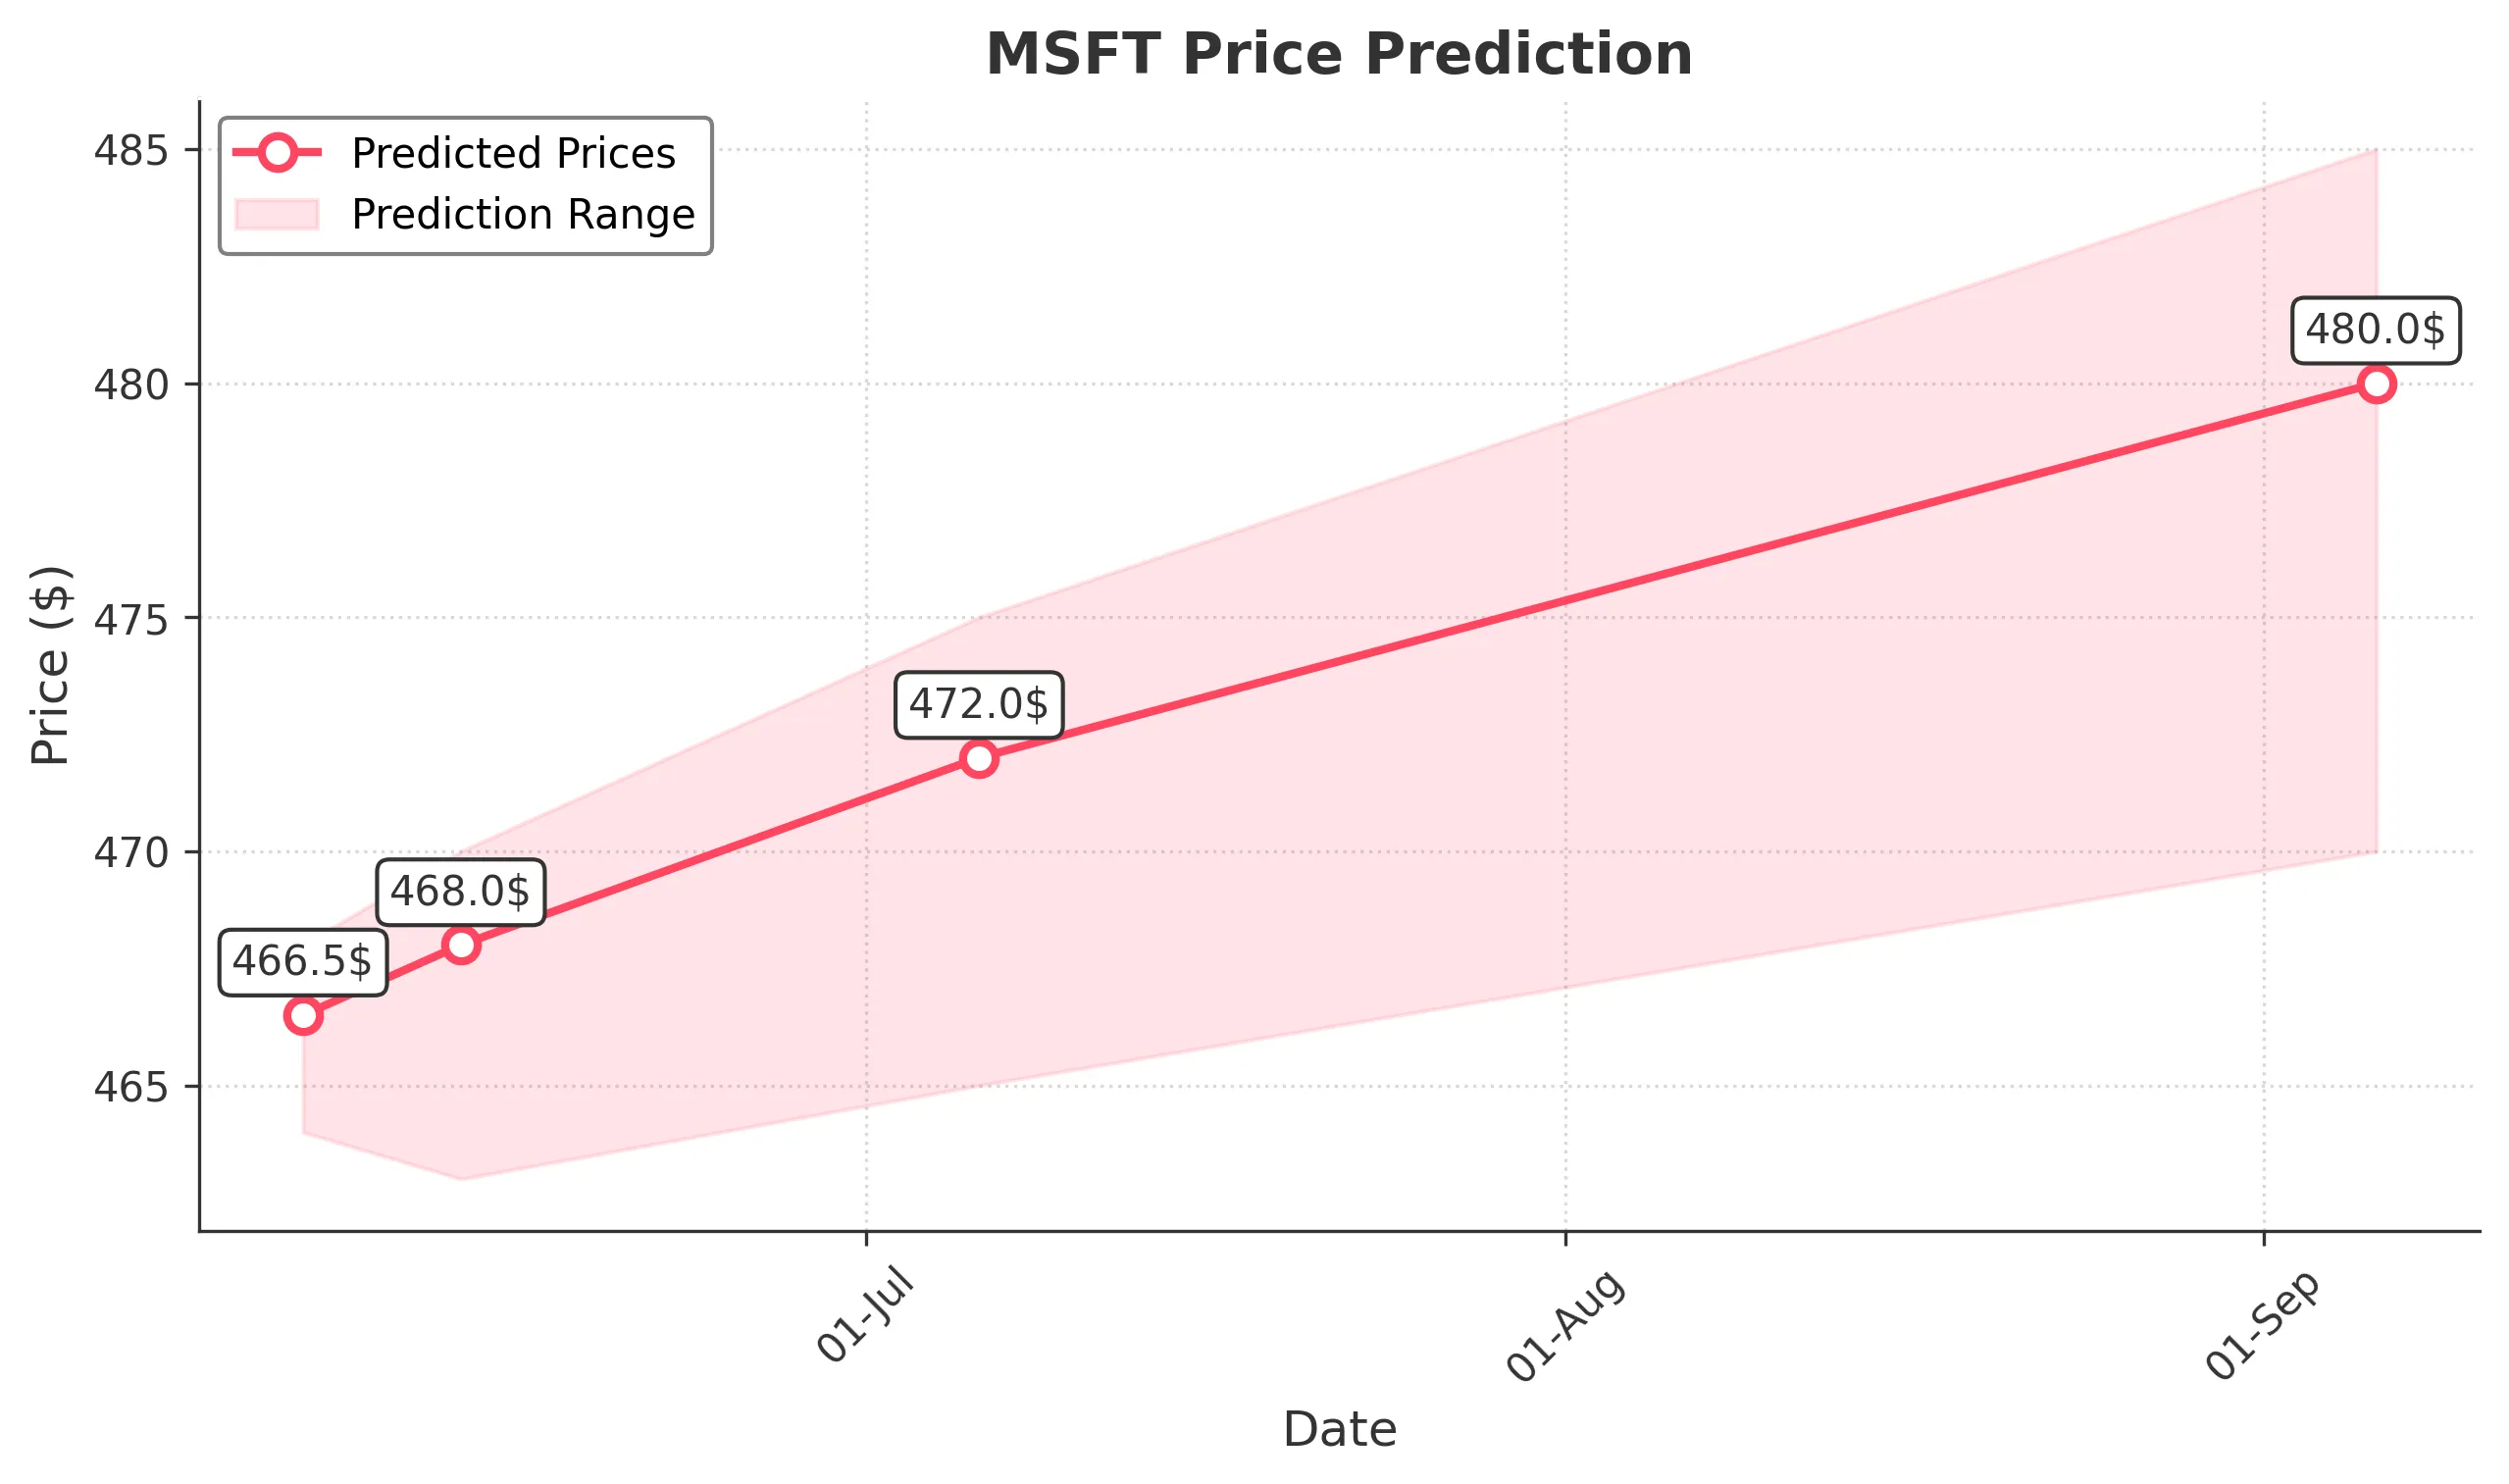
Target: June 6, 2025$466.5
$465.5
$468
$464
Description
The stock shows a bullish trend with a recent breakout above resistance at 465. The RSI is approaching overbought levels, indicating potential upward momentum. However, caution is advised as volatility may increase.
Analysis
MSFT has shown a strong bullish trend over the past three months, with significant support at 450 and resistance around 465. The recent volume spikes indicate strong buying interest, while the MACD suggests upward momentum. However, the RSI nearing overbought levels raises concerns about a possible correction.
Confidence Level
Potential Risks
Potential profit-taking could lead to a pullback, and external market factors may influence price.
1 Week Prediction
Target: June 13, 2025$468
$466.5
$470
$463
Description
The bullish trend is expected to continue, supported by strong buying volume. The MACD remains positive, and the stock is likely to test the 470 resistance level. Watch for potential pullbacks as the RSI approaches overbought territory.
Analysis
Over the past three months, MSFT has demonstrated a clear upward trajectory, with key support at 450 and resistance at 470. The Bollinger Bands indicate potential for continued volatility, while the ATR suggests increasing price movement. Volume patterns show consistent buying interest, but external factors could introduce uncertainty.
Confidence Level
Potential Risks
Market sentiment could shift due to macroeconomic news, impacting the stock's performance.
1 Month Prediction
Target: July 6, 2025$472
$468
$475
$465
Description
The stock is expected to maintain its bullish momentum, potentially reaching new highs. The MACD remains bullish, and the RSI may stabilize after a brief overbought condition. Watch for any market corrections.
Analysis
MSFT's performance has been strong, with a bullish trend supported by solid fundamentals. Key resistance at 470 may be tested, while support remains at 450. The MACD and moving averages indicate upward momentum, but external economic factors could introduce volatility.
Confidence Level
Potential Risks
Economic indicators and earnings reports could lead to volatility, affecting the stock's trajectory.
3 Months Prediction
Target: September 6, 2025$480
$472
$485
$470
Description
Long-term bullish sentiment is expected to drive the stock higher, with potential to reach 480. The overall market sentiment remains positive, but watch for any macroeconomic shifts that could impact performance.
Analysis
MSFT has shown resilience with a strong upward trend over the past three months. Key support at 450 and resistance at 470 are critical levels to monitor. The stock's performance is influenced by broader market trends and economic indicators, which could introduce volatility in the coming months.
Confidence Level
Potential Risks
Long-term predictions are subject to greater uncertainty due to potential market corrections and economic changes.