MSFT Trading Predictions
1 Day Prediction
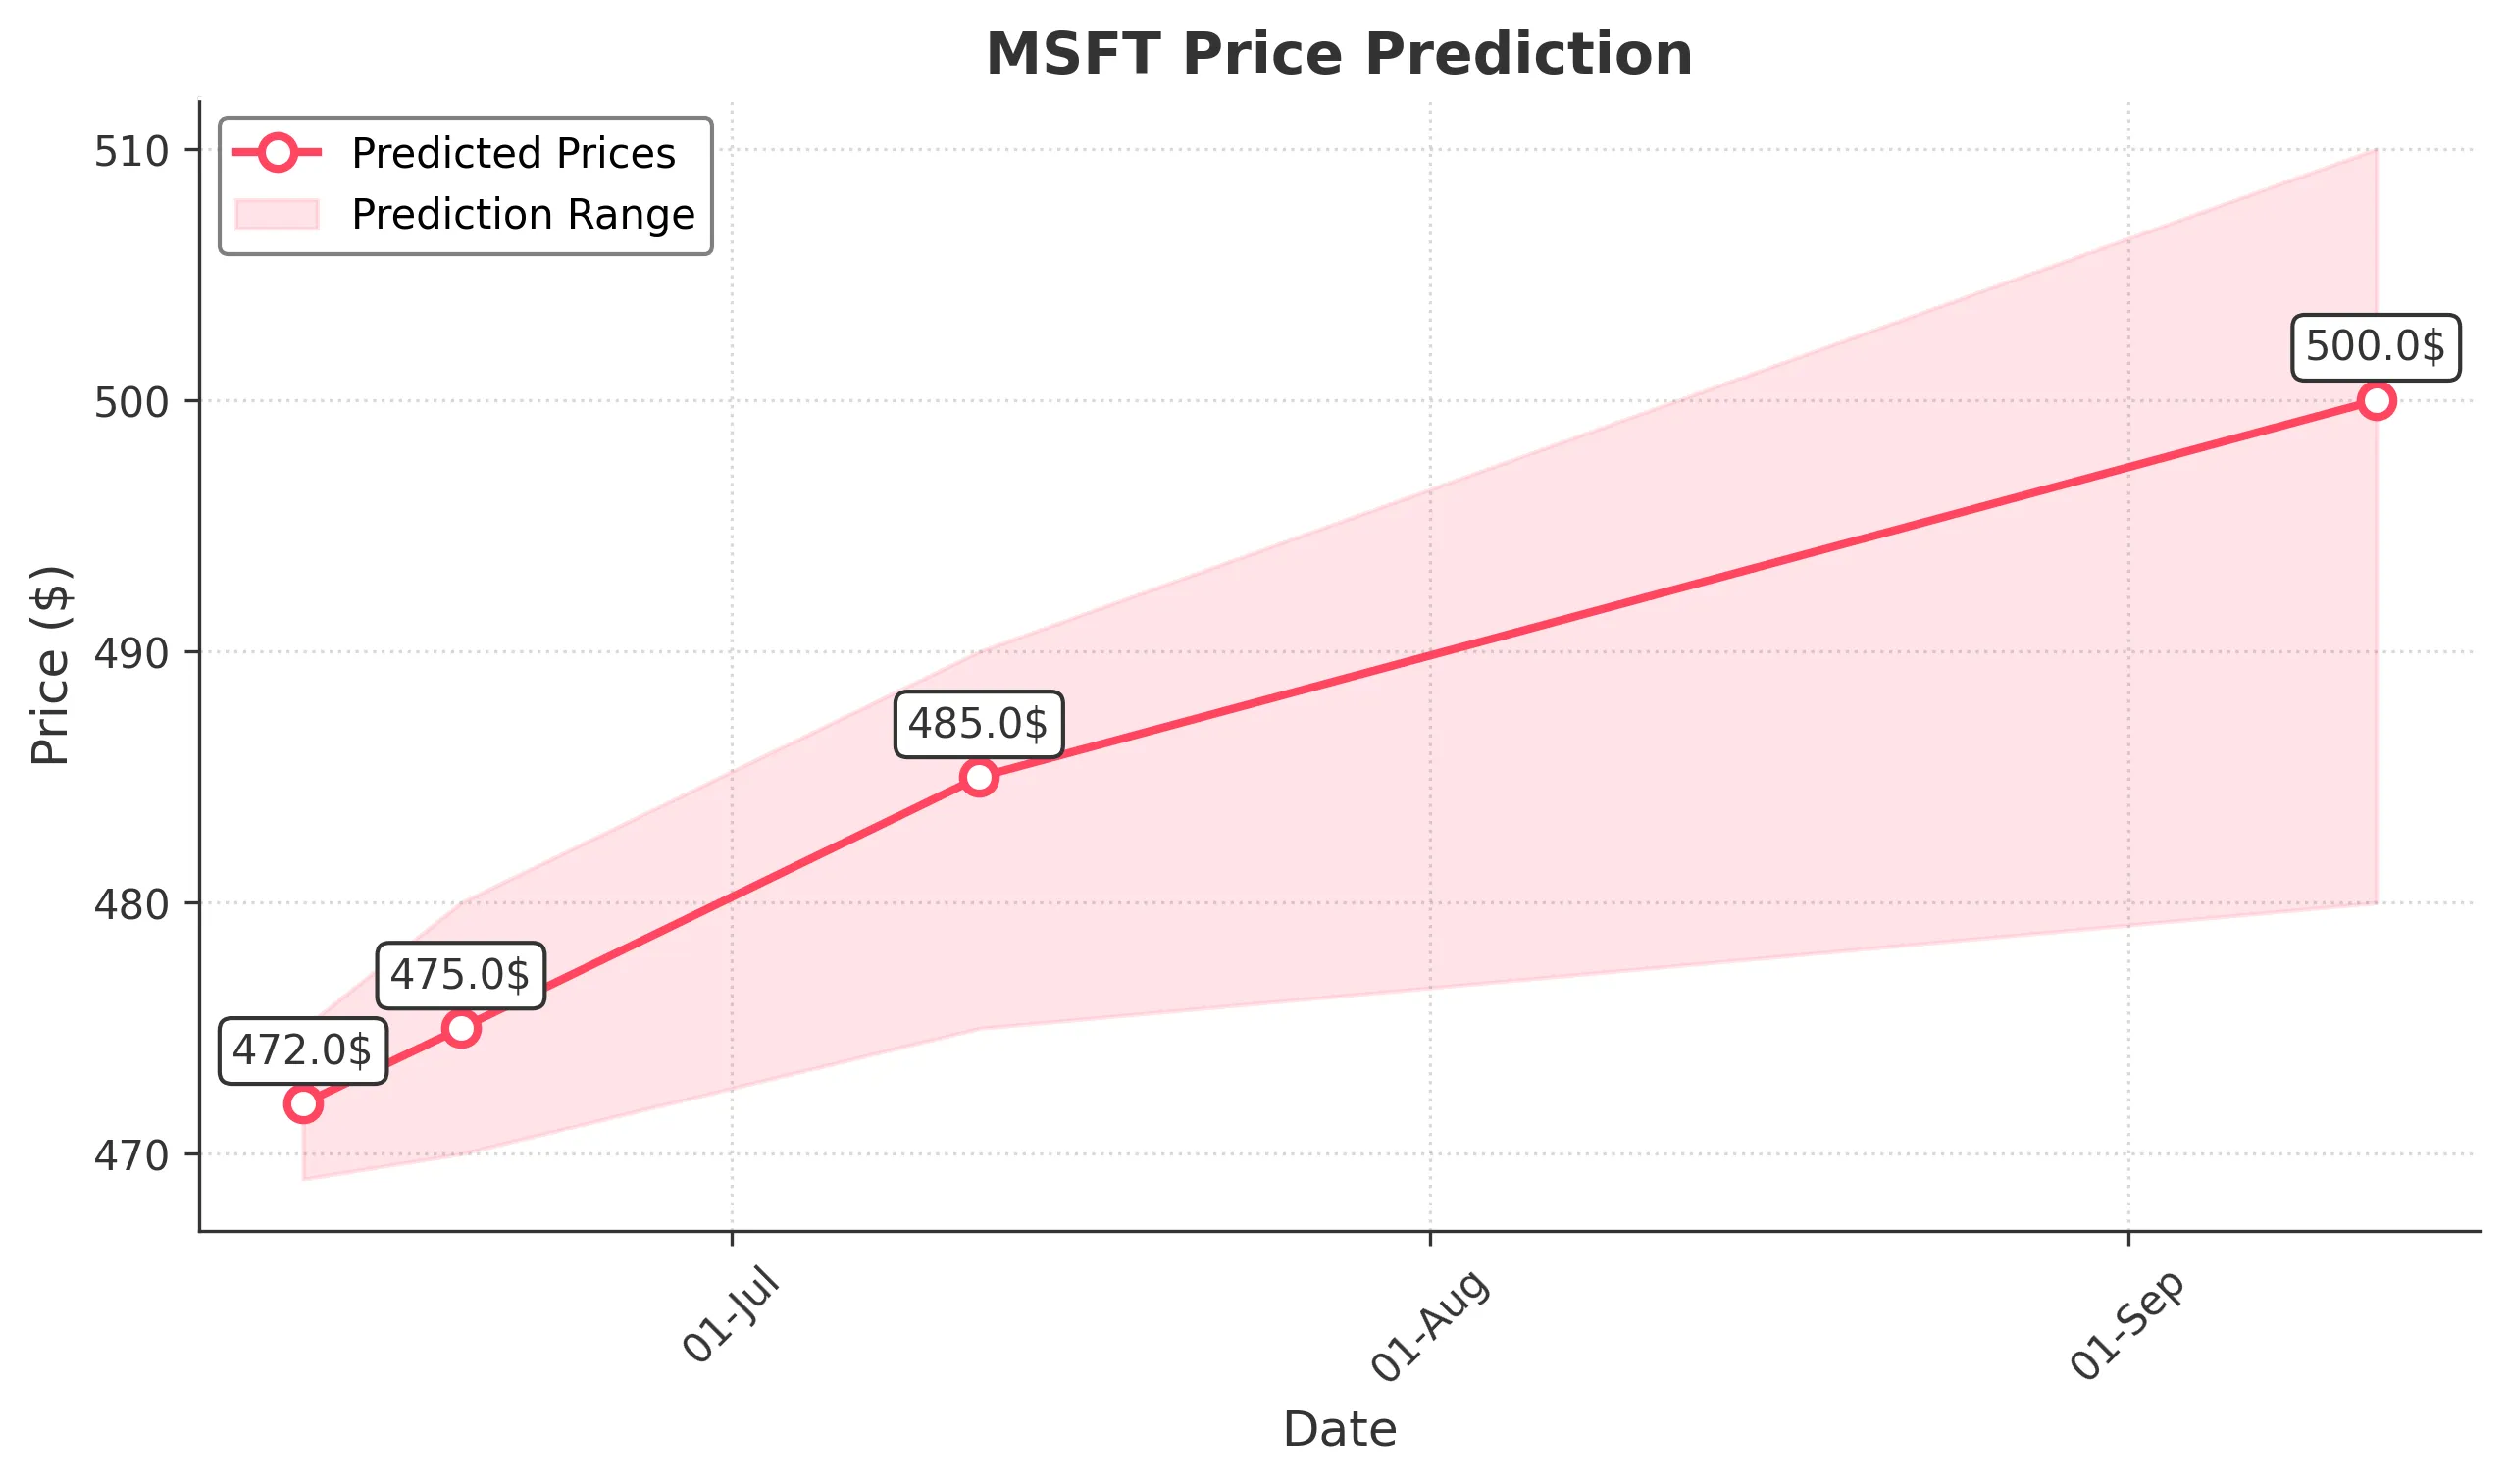
Target: June 12, 2025$472
$471.5
$475
$469
Description
The stock shows a bullish trend with a recent upward movement. The RSI is nearing overbought levels, indicating potential for a pullback. However, strong support at 470 and positive market sentiment suggest a slight increase in price.
Analysis
Over the past 3 months, MSFT has shown a bullish trend, with significant support at 470 and resistance around 475. The recent volume spikes indicate strong buying interest. Technical indicators like MACD are bullish, but RSI suggests caution.
Confidence Level
Potential Risks
Potential volatility due to macroeconomic news could impact the prediction.
1 Week Prediction
Target: June 19, 2025$475
$472.5
$480
$470
Description
The stock is expected to continue its upward trajectory, supported by strong buying momentum. However, the RSI indicates overbought conditions, which may lead to a short-term pullback. Watch for resistance at 480.
Analysis
MSFT has been on a bullish run, with key support at 470. The MACD is positive, and volume trends suggest strong interest. However, the stock is approaching overbought territory, which could lead to volatility.
Confidence Level
Potential Risks
Market corrections or negative news could reverse the trend.
1 Month Prediction
Target: July 12, 2025$485
$480
$490
$475
Description
Continued bullish sentiment is expected, with potential for new highs. The Fibonacci retracement levels suggest strong support at 475. However, watch for market corrections as the stock approaches resistance at 490.
Analysis
The stock has shown a strong upward trend, with significant support at 475. Technical indicators remain bullish, but the RSI is nearing overbought levels. Volume patterns indicate sustained interest, but caution is advised.
Confidence Level
Potential Risks
External economic factors could impact growth, leading to unexpected volatility.
3 Months Prediction
Target: September 12, 2025$500
$490
$510
$480
Description
If the bullish trend continues, MSFT could reach 500, driven by strong fundamentals and market sentiment. However, potential market corrections and economic factors could lead to volatility.
Analysis
MSFT has maintained a bullish trend, with key support at 480. The stock's performance is influenced by broader market conditions and economic indicators. While the outlook is positive, risks remain due to potential market corrections.
Confidence Level
Potential Risks
Unforeseen macroeconomic events could significantly alter the stock's trajectory.