MSFT Trading Predictions
1 Day Prediction
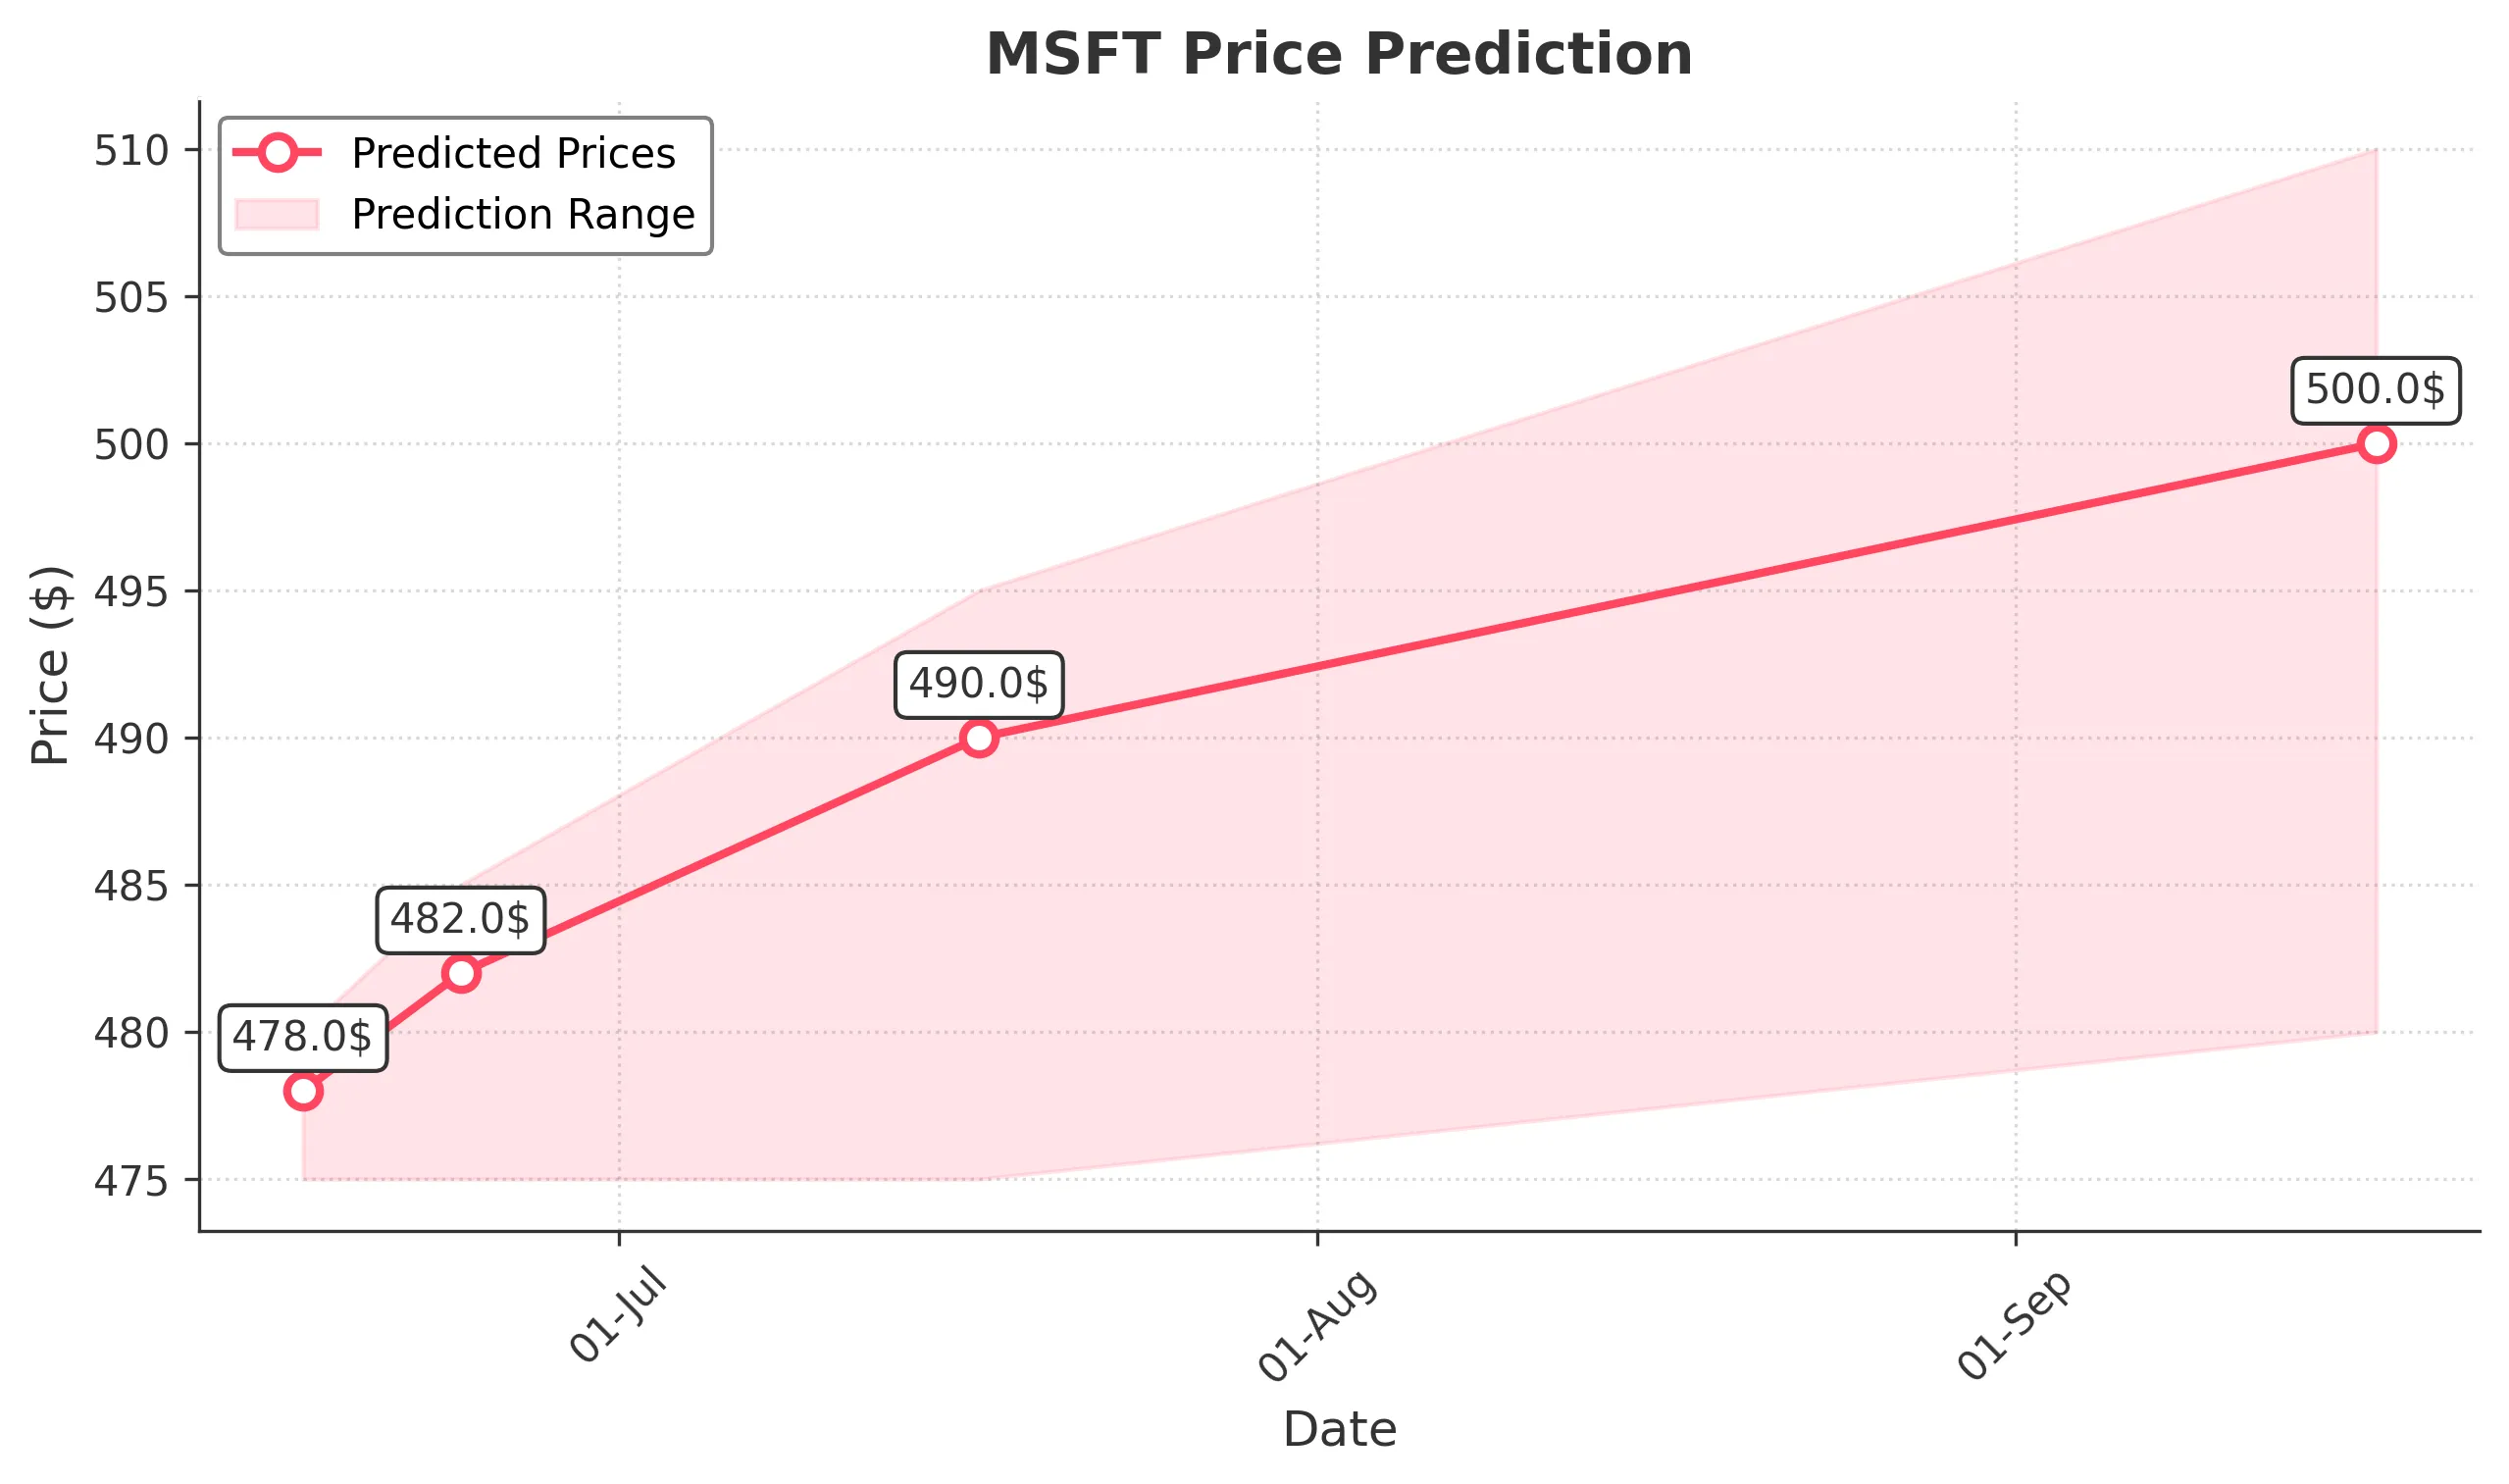
Target: June 17, 2025$478
$477
$480
$475
Description
The stock shows bullish momentum with a recent close above the 50-day moving average. RSI is near 70, indicating overbought conditions, but MACD remains positive. Expect slight pullback but overall upward trend.
Analysis
MSFT has shown a strong bullish trend over the past 3 months, with significant support at $470 and resistance around $480. Volume has been consistent, indicating strong interest. Recent candlestick patterns suggest bullish continuation.
Confidence Level
Potential Risks
Potential for a reversal due to overbought RSI levels and market volatility.
1 Week Prediction
Target: June 24, 2025$482
$479
$485
$475
Description
The upward trend is expected to continue, supported by strong buying volume. The MACD indicates bullish momentum, while the RSI may correct slightly. Anticipate a test of resistance at $485.
Analysis
The stock has been in a bullish phase, with key support at $470. The recent price action shows a strong upward trajectory, but caution is warranted as the RSI approaches overbought territory.
Confidence Level
Potential Risks
Market sentiment could shift due to macroeconomic factors or earnings reports, which may impact the stock's performance.
1 Month Prediction
Target: July 17, 2025$490
$482
$495
$475
Description
Continued bullish sentiment is expected, with potential for new highs. The stock is likely to test the Fibonacci retracement level at $490. Watch for any bearish divergence in RSI.
Analysis
MSFT has maintained a strong bullish trend, with significant support at $470. The stock's performance is bolstered by positive market sentiment, but external factors could lead to increased volatility.
Confidence Level
Potential Risks
Economic indicators and earnings reports could introduce volatility, impacting the stock's upward momentum.
3 Months Prediction
Target: September 17, 2025$500
$490
$510
$480
Description
Long-term bullish outlook with potential to reach $500, driven by strong fundamentals and market demand. However, watch for potential corrections as the stock approaches this psychological level.
Analysis
Over the past 3 months, MSFT has shown a strong upward trend, with key support at $470 and resistance at $500. The stock's performance is influenced by positive market sentiment, but external factors could introduce risks.
Confidence Level
Potential Risks
Market corrections, economic downturns, or negative news could impact the stock's ability to maintain upward momentum.