MSFT Trading Predictions
1 Day Prediction
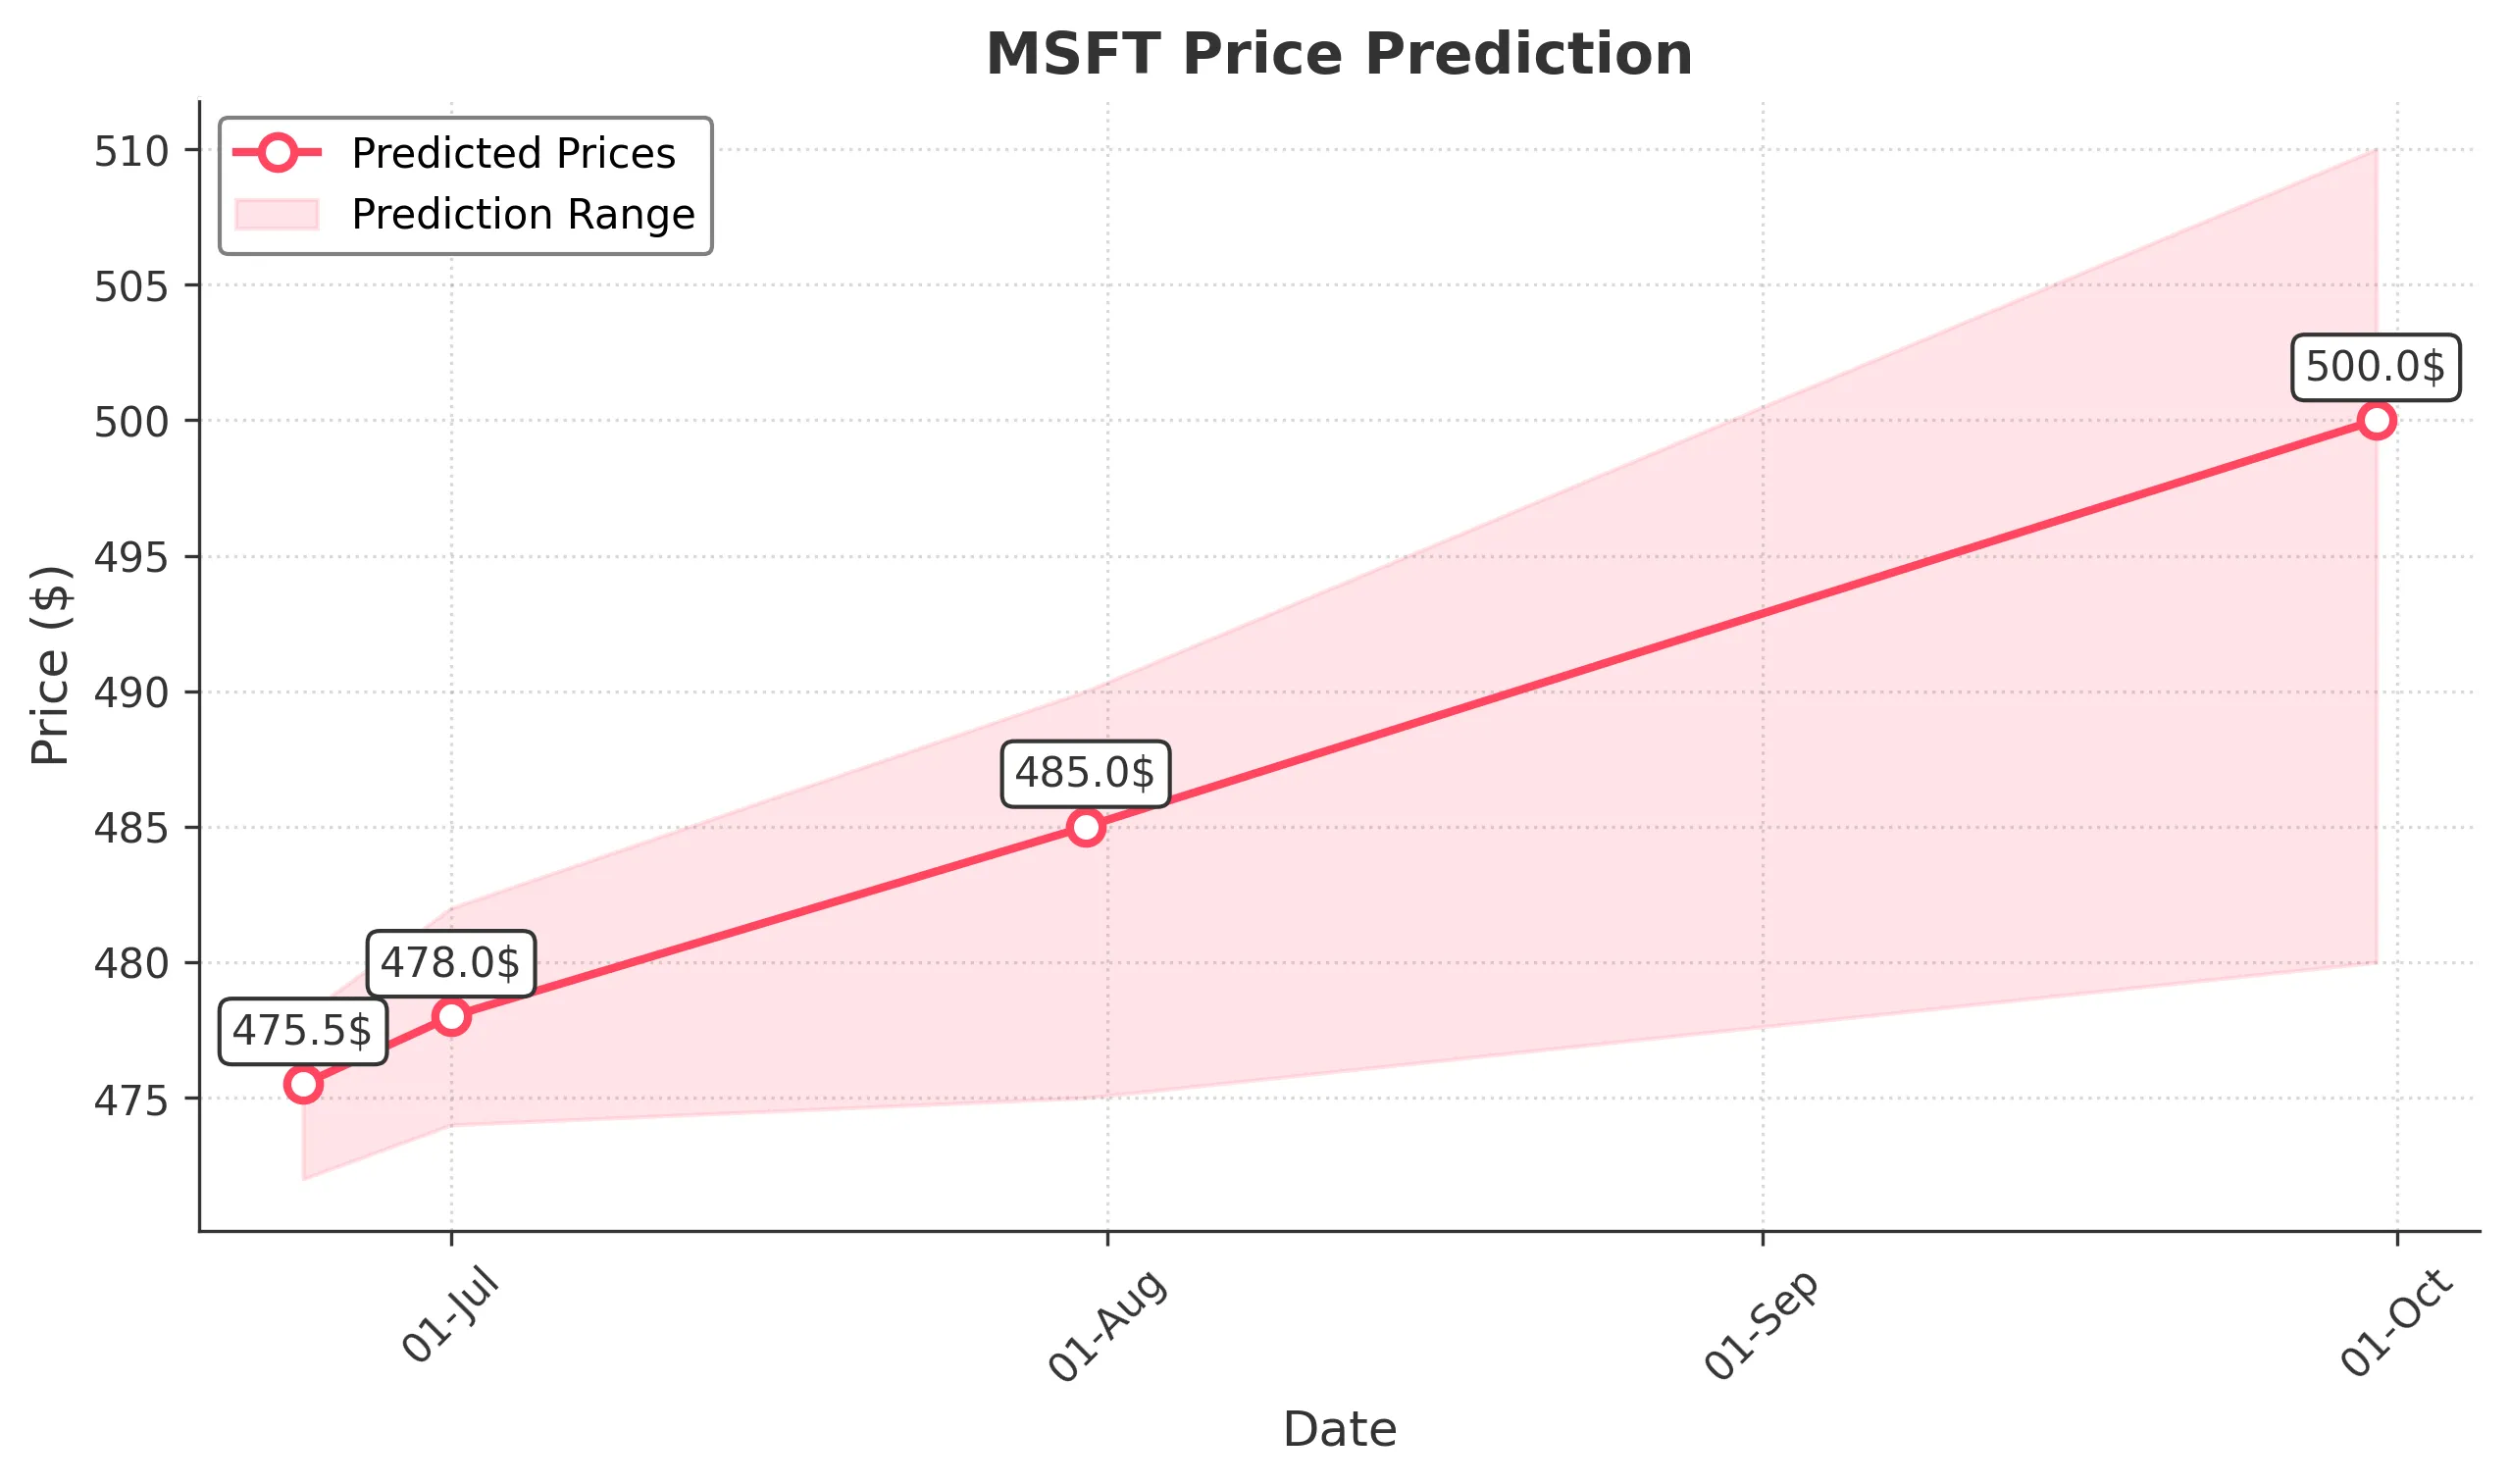
Target: June 24, 2025$475.5
$475
$478
$472
Description
The stock shows a slight bullish trend with a recent Doji candlestick indicating indecision. RSI is neutral, and MACD is close to crossing above the signal line, suggesting potential upward momentum. However, volatility remains a concern.
Analysis
Over the past 3 months, MSFT has shown a bullish trend with significant support around $470. The recent price action indicates a potential consolidation phase. Technical indicators like the MACD and RSI suggest upward momentum, but volatility remains high, and external factors could influence price movements.
Confidence Level
Potential Risks
Market sentiment could shift due to macroeconomic news or earnings reports, which may impact the stock's performance.
1 Week Prediction
Target: July 1, 2025$478
$475.5
$482
$474
Description
The stock is expected to continue its upward trajectory, supported by recent bullish candlestick patterns. The MACD indicates a potential bullish crossover, while the RSI remains in a healthy range. Volume is expected to increase as traders react to market sentiment.
Analysis
MSFT has been on a bullish run, with key resistance at $480. The stock's performance has been supported by strong volume and positive technical indicators. However, external economic factors and earnings reports could introduce volatility.
Confidence Level
Potential Risks
Potential market corrections or negative news could impact the stock's upward movement.
1 Month Prediction
Target: July 31, 2025$485
$478
$490
$475
Description
The stock is projected to reach new highs as bullish momentum continues. The Fibonacci retracement levels suggest a target around $485, with strong support at $475. The overall market sentiment remains positive, but caution is advised.
Analysis
MSFT has shown resilience with a bullish trend over the past months. Key support levels are holding firm, and technical indicators suggest continued upward movement. However, external economic factors could introduce risks.
Confidence Level
Potential Risks
Market volatility and potential economic downturns could affect the stock's performance.
3 Months Prediction
Target: September 30, 2025$500
$485
$510
$480
Description
The stock is expected to reach $500 as it breaks through key resistance levels. The bullish trend is supported by strong fundamentals and positive market sentiment. However, potential market corrections could pose risks.
Analysis
MSFT has maintained a strong upward trend, with significant support at $480. The stock's performance is bolstered by positive technical indicators and market sentiment. However, external factors could introduce uncertainty in the coming months.
Confidence Level
Potential Risks
Unforeseen macroeconomic events or earnings surprises could lead to volatility and impact the stock's trajectory.