MSFT Trading Predictions
1 Day Prediction
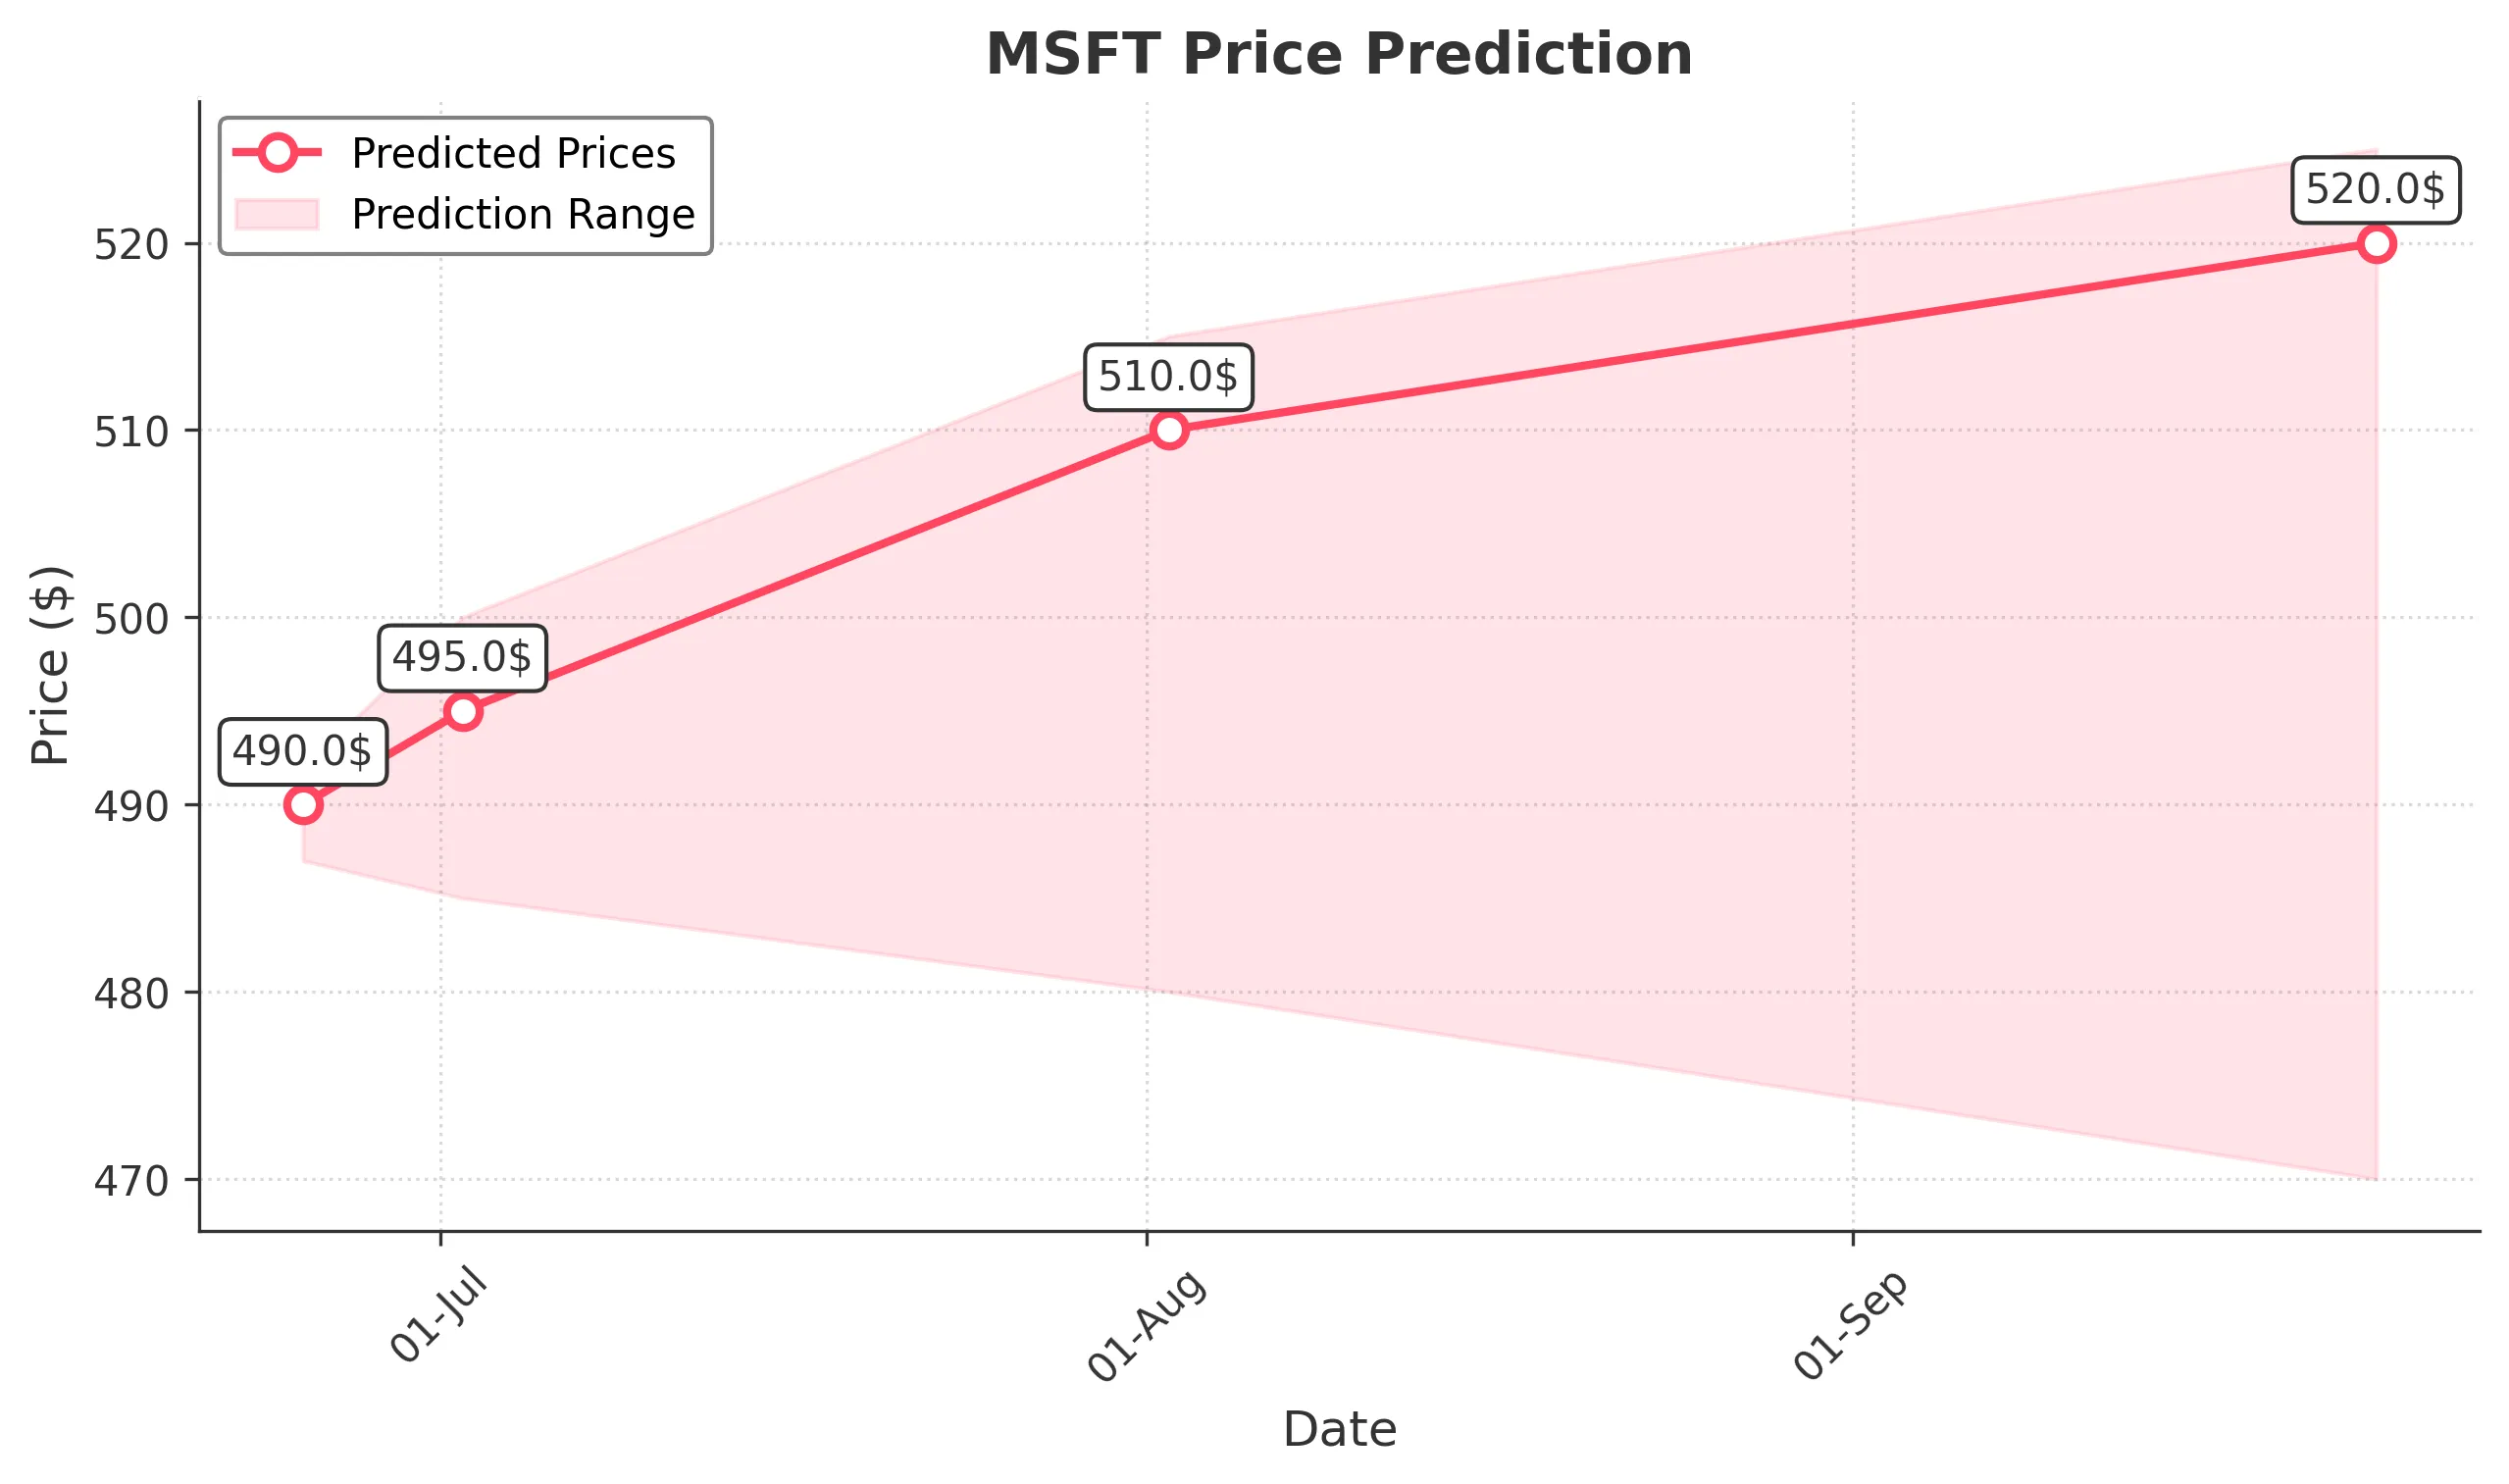
Target: June 25, 2025$490
$488.605011
$492
$487
Description
The stock shows bullish momentum with a recent breakout above resistance at 488.60. RSI indicates overbought conditions, but MACD remains positive. Expect a slight pullback before continuing upward, supported by strong volume.
Analysis
MSFT has been in a strong bullish trend, recently breaking above key resistance levels. The RSI is approaching overbought territory, indicating potential for a pullback. Volume has been robust, suggesting strong buying interest. Key support is at 480.
Confidence Level
Potential Risks
Potential profit-taking could lead to volatility. Watch for any bearish reversal patterns.
1 Week Prediction
Target: July 2, 2025$495
$490
$500
$485
Description
The bullish trend is expected to continue as the stock breaks through 490. The MACD remains positive, and the recent candlestick patterns suggest further upward movement. Watch for potential resistance at 500.
Analysis
MSFT's performance has been strong, with consistent upward movement. The stock is approaching significant resistance at 500. Volume patterns indicate strong buying interest, but external factors could introduce volatility.
Confidence Level
Potential Risks
Market sentiment could shift due to macroeconomic news, which may impact the stock's performance.
1 Month Prediction
Target: August 2, 2025$510
$495
$515
$480
Description
Continued bullish momentum is expected, with the stock likely to test the 515 resistance level. The Fibonacci retracement levels support this upward trend, but watch for any bearish divergence in RSI.
Analysis
The stock has shown strong bullish trends, with key support at 480. However, the RSI indicates potential overbought conditions, suggesting a risk of pullbacks. Volume remains strong, but external factors could introduce uncertainty.
Confidence Level
Potential Risks
Potential market corrections or negative news could impact the stock's trajectory.
3 Months Prediction
Target: September 24, 2025$520
$510
$525
$470
Description
The stock is expected to maintain an upward trajectory, potentially reaching 525. However, macroeconomic factors and earnings reports could introduce volatility. Watch for support at 480.
Analysis
MSFT has shown a strong bullish trend, but the market's overall sentiment and economic conditions could lead to fluctuations. Key support levels are at 480, and resistance at 525 may pose challenges. Volume trends indicate strong interest, but caution is advised.
Confidence Level
Potential Risks
Market conditions and economic indicators may lead to unexpected volatility, impacting the stock's performance.