MSFT Trading Predictions
1 Day Prediction
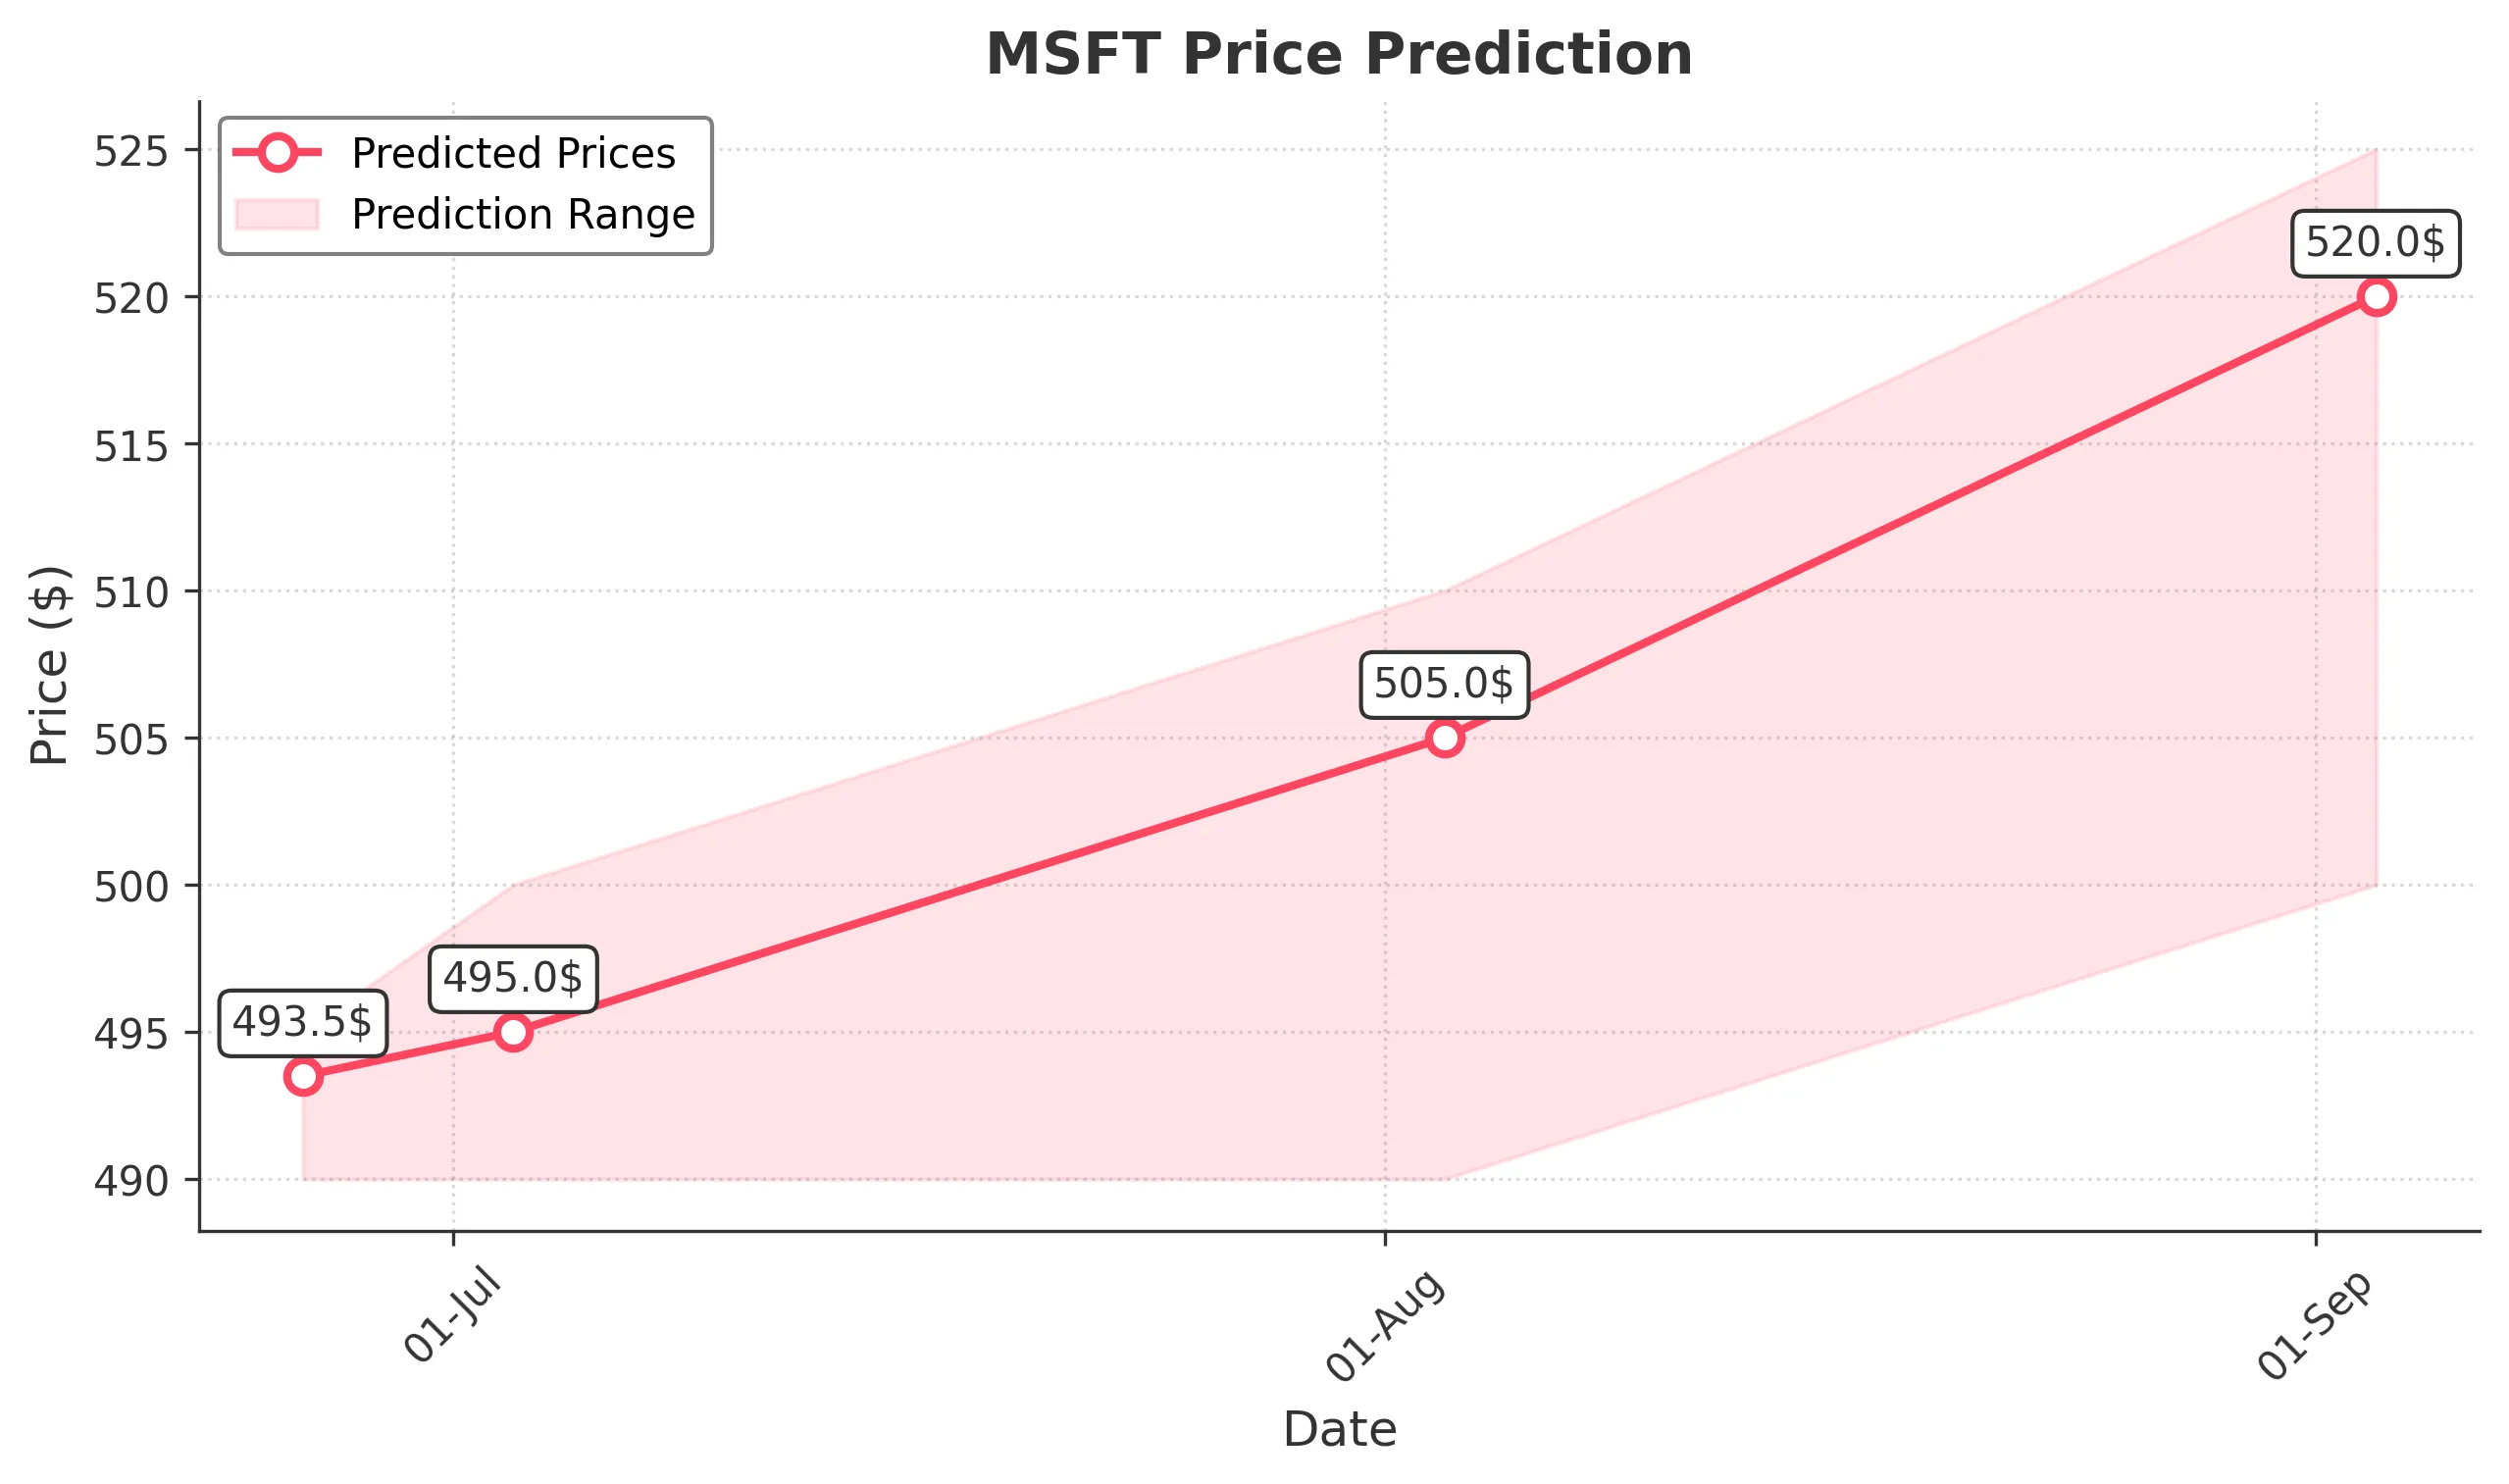
Target: June 26, 2025$493.5
$492.820007
$495
$490
Description
The stock shows bullish momentum with a recent close above key resistance at 492. The RSI is approaching overbought levels, indicating potential for a pullback. However, strong volume suggests continued interest. Expect a slight upward movement.
Analysis
Over the past 3 months, MSFT has shown a bullish trend, breaking through significant resistance levels. The recent price action indicates strong buying interest, with volume spikes supporting upward momentum. Key support is at 480, while resistance is at 495.
Confidence Level
Potential Risks
Potential for a pullback if RSI exceeds overbought levels. Market sentiment could shift due to external factors.
1 Week Prediction
Target: July 3, 2025$495
$493.5
$500
$490
Description
The stock is expected to continue its upward trajectory, with strong bullish signals from moving averages and MACD. However, the RSI indicates overbought conditions, suggesting a possible correction. Watch for volatility.
Analysis
MSFT has maintained a bullish trend, with recent highs indicating strong demand. The MACD is positive, and the stock is trading above its moving averages. Key support is at 490, while resistance is at 500. Volume remains robust.
Confidence Level
Potential Risks
Market volatility and potential profit-taking could lead to price fluctuations. External economic news may impact sentiment.
1 Month Prediction
Target: August 3, 2025$505
$495
$510
$490
Description
Expect continued bullish momentum as the stock breaks through resistance levels. The Fibonacci retracement levels suggest potential upside to 510. However, watch for signs of exhaustion as RSI approaches overbought territory.
Analysis
The stock has shown strong performance, with a clear upward trend. Recent volume spikes indicate strong buying interest. Key support is at 490, while resistance is at 510. The market sentiment remains positive, but caution is advised.
Confidence Level
Potential Risks
Market corrections and external economic factors could impact the stock's performance. Watch for any bearish reversal patterns.
3 Months Prediction
Target: September 3, 2025$520
$505
$525
$500
Description
Long-term bullish outlook as the stock is expected to break through key resistance levels. The overall market sentiment is positive, but potential economic shifts could introduce volatility. Monitor for any bearish signals.
Analysis
MSFT has shown a strong upward trend over the past three months, with significant support at 500. The stock is trading above its moving averages, indicating bullish momentum. However, external economic factors could introduce risks.
Confidence Level
Potential Risks
Economic conditions and market sentiment could shift, leading to unexpected volatility. Watch for any signs of reversal or bearish patterns.