MSFT Trading Predictions
1 Day Prediction
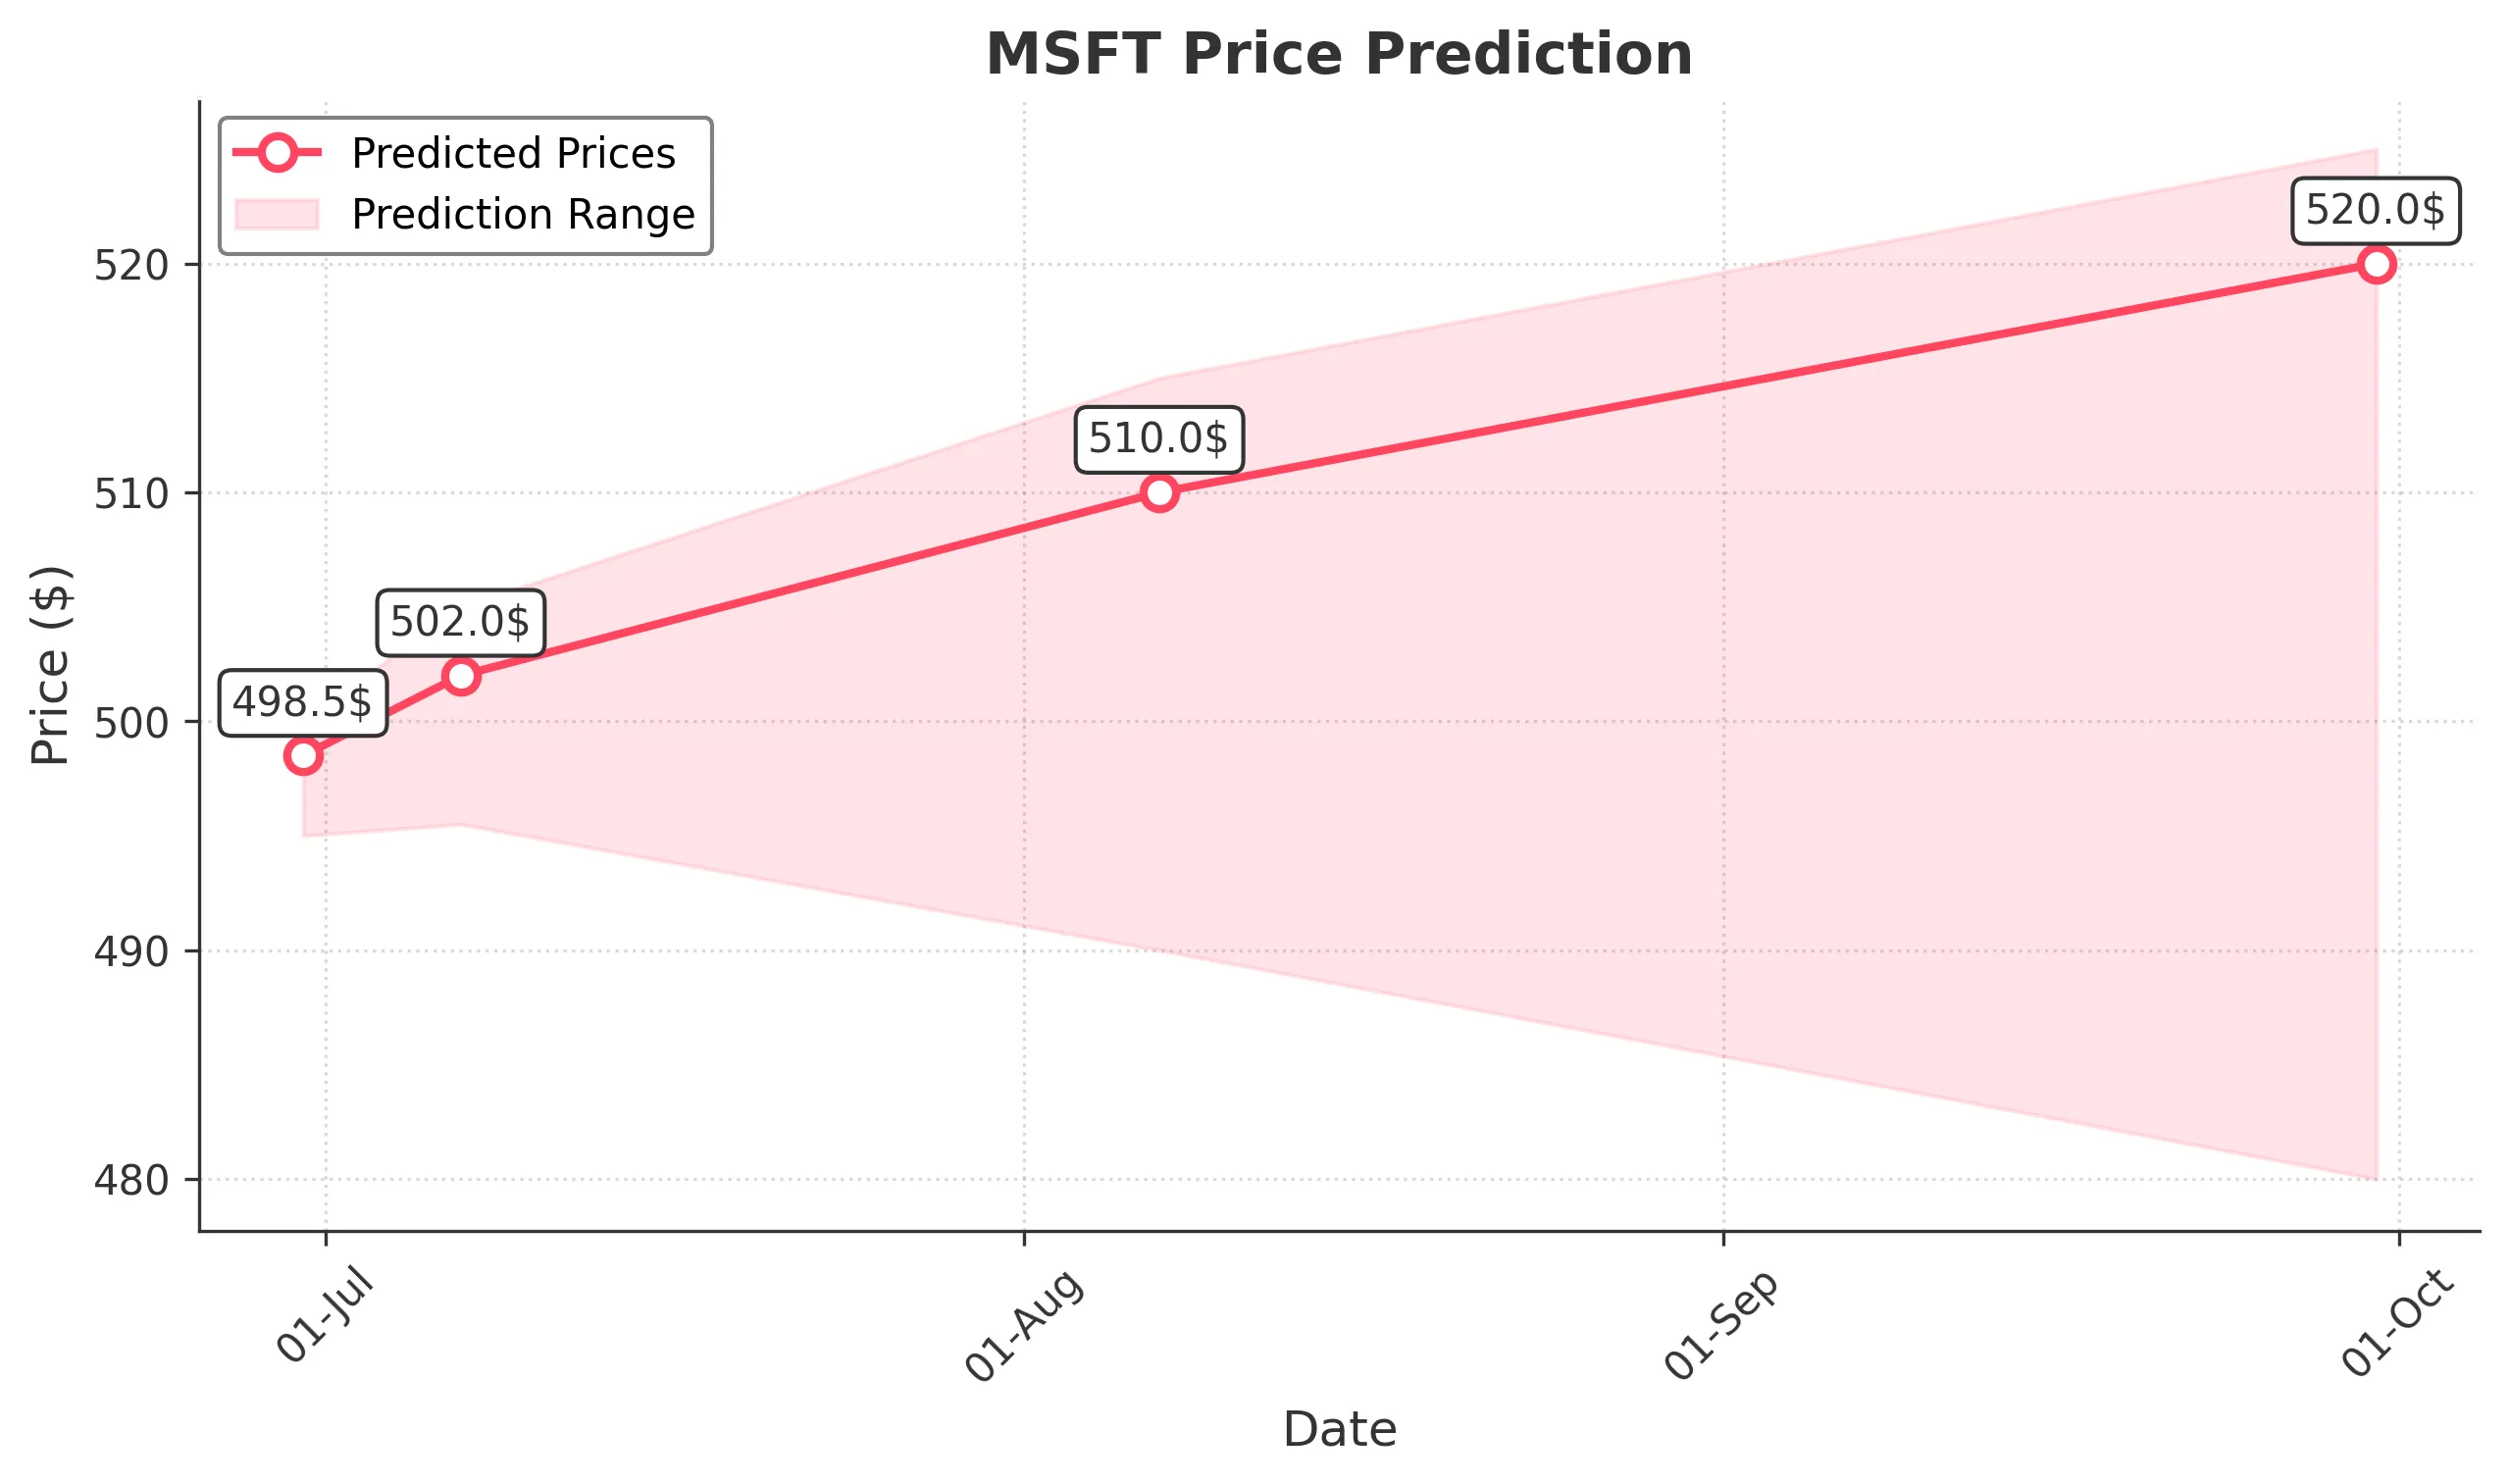
Target: June 30, 2025$498.5
$497.5
$500
$495
Description
The stock shows bullish momentum with a recent close above key resistance at 497. The RSI is nearing overbought levels, suggesting potential for a pullback. However, strong volume indicates continued interest. Expect a slight upward movement.
Analysis
Over the past 3 months, MSFT has shown a bullish trend, breaking through resistance levels. The recent price action indicates strong buying interest, with significant volume spikes. Key support is at 490, while resistance is at 500. Technical indicators like MACD and moving averages support upward momentum.
Confidence Level
Potential Risks
Potential for a pullback if RSI exceeds overbought levels. Market sentiment may shift due to external factors.
1 Week Prediction
Target: July 7, 2025$502
$498.5
$505
$495.5
Description
The bullish trend is expected to continue as the stock breaks above 500. The MACD shows positive momentum, and the volume remains strong. However, the RSI indicates overbought conditions, which could lead to volatility.
Analysis
MSFT has maintained a strong upward trajectory, with significant support at 490. The recent price action suggests bullish sentiment, but overbought conditions may lead to short-term corrections. Volume analysis shows consistent buying interest, indicating a healthy market environment.
Confidence Level
Potential Risks
Market corrections could occur if profit-taking happens. External economic news may also impact sentiment.
1 Month Prediction
Target: August 7, 2025$510
$502
$515
$490
Description
The stock is expected to reach new highs as it consolidates above 500. The bullish trend is supported by strong fundamentals and positive market sentiment. However, watch for potential pullbacks as the RSI remains elevated.
Analysis
MSFT's performance has been robust, with a clear bullish trend. Key support is at 490, while resistance is at 515. The stock's upward movement is supported by strong volume and positive technical indicators, but caution is advised due to overbought conditions.
Confidence Level
Potential Risks
Market volatility and potential profit-taking could lead to fluctuations. Economic indicators may also influence performance.
3 Months Prediction
Target: September 30, 2025$520
$510
$525
$480
Description
Long-term bullish outlook as MSFT continues to capitalize on strong market fundamentals. The stock is expected to break through resistance levels, but watch for potential corrections as the market adjusts.
Analysis
Over the past three months, MSFT has shown a strong bullish trend, with significant support at 490 and resistance at 525. The stock's performance is bolstered by strong fundamentals and positive market sentiment, but potential volatility remains a concern as external factors may influence the market.
Confidence Level
Potential Risks
Unforeseen macroeconomic events or shifts in market sentiment could impact the stock's trajectory. Watch for earnings reports and economic data.