MSFT Trading Predictions
1 Day Prediction
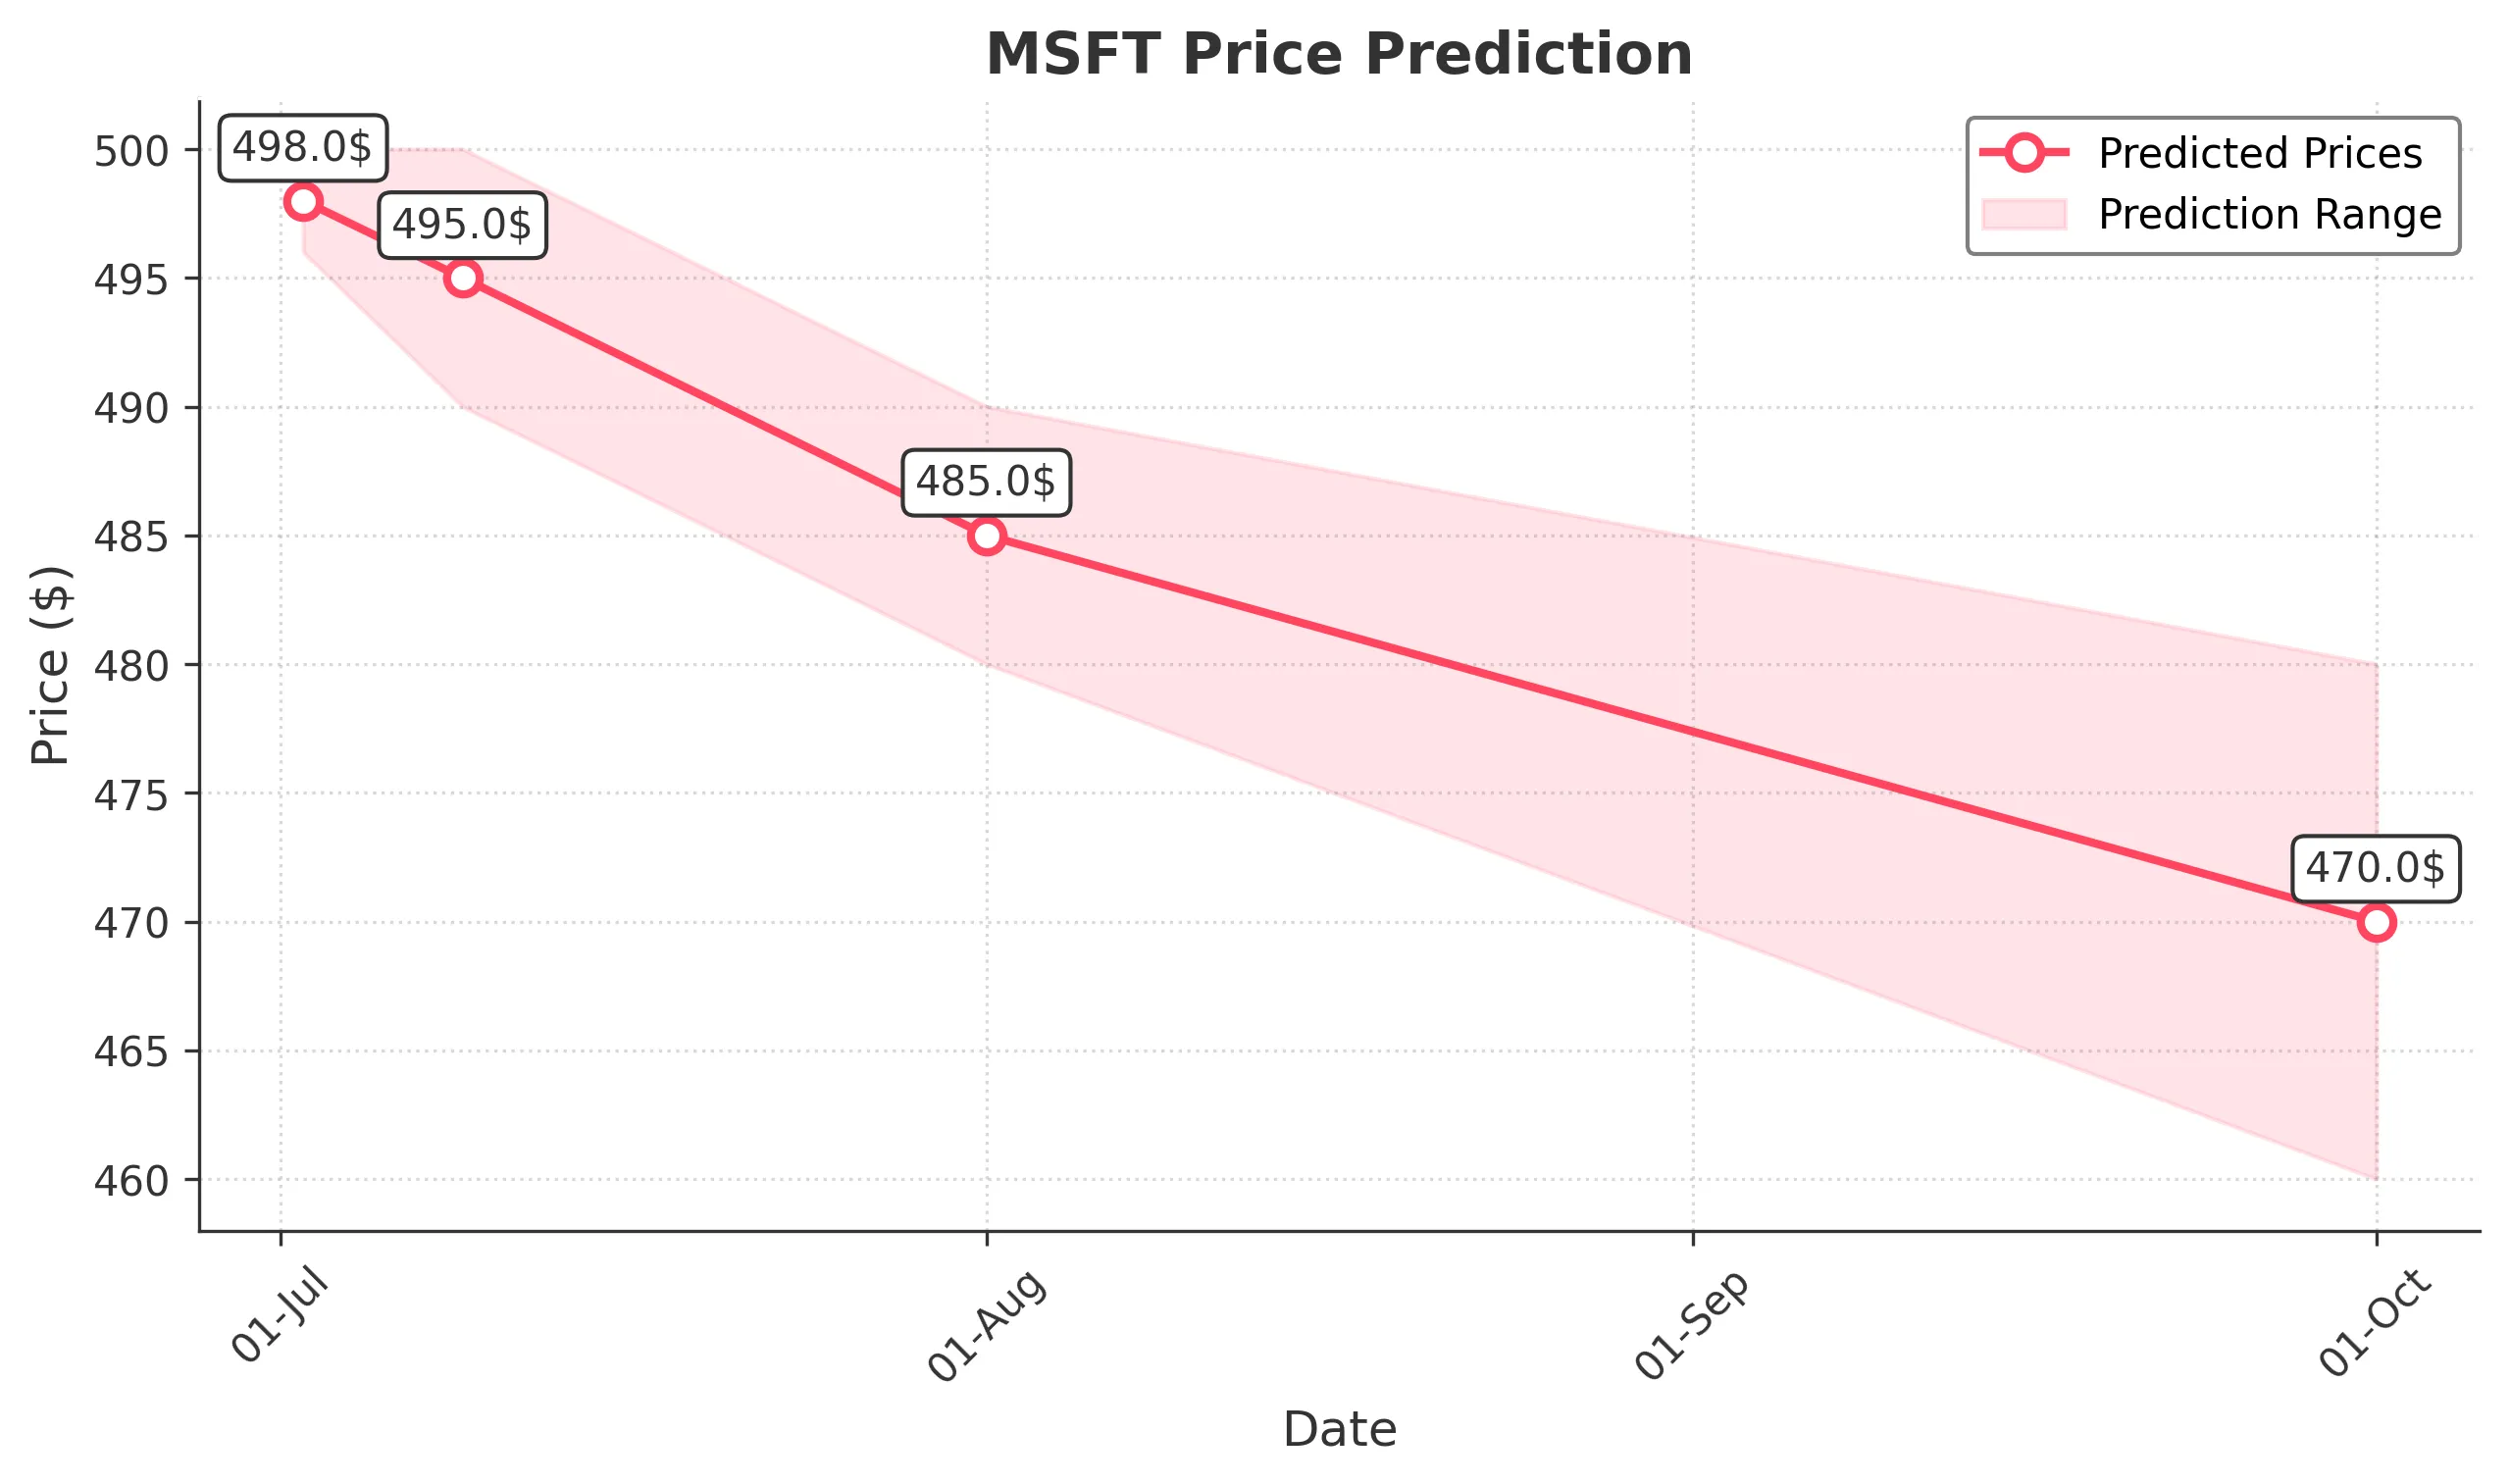
Target: July 2, 2025$498
$497.5
$500
$496
Description
The stock shows a bullish trend with a recent close above the 50-day moving average. RSI indicates overbought conditions, suggesting a potential pullback. However, strong buying volume supports upward momentum.
Analysis
MSFT has shown a strong bullish trend over the past three months, with significant support at $490 and resistance at $500. The recent price action indicates a continuation pattern, but overbought RSI levels suggest caution.
Confidence Level
Potential Risks
Potential profit-taking could lead to a short-term decline. Market sentiment may shift due to macroeconomic news.
1 Week Prediction
Target: July 9, 2025$495
$498
$500
$490
Description
Expect a slight pullback as the stock approaches resistance at $500. The MACD shows a bearish divergence, indicating potential weakness. Volume may decrease as traders take profits.
Analysis
The stock has been in a strong uptrend, but recent candlestick patterns suggest a potential reversal. Key support at $490 will be critical to watch. Volume trends indicate some profit-taking, which could lead to short-term weakness.
Confidence Level
Potential Risks
Market volatility and external economic factors could impact performance. A sudden negative news event could exacerbate declines.
1 Month Prediction
Target: August 1, 2025$485
$495
$490
$480
Description
A bearish trend may develop as the stock faces resistance at $500. The Bollinger Bands indicate potential volatility, and a break below $490 could trigger further selling.
Analysis
Over the past three months, MSFT has shown strong performance but is now facing resistance. The stock's volatility is increasing, and the potential for a correction exists. Key support levels will be crucial in determining future direction.
Confidence Level
Potential Risks
Economic indicators and earnings reports could significantly influence stock performance. A strong earnings report could reverse bearish sentiment.
3 Months Prediction
Target: October 1, 2025$470
$485
$480
$460
Description
Longer-term bearish sentiment may prevail as the stock approaches critical support levels. Economic conditions and market sentiment will play a significant role in price action.
Analysis
The stock has shown a strong bullish trend but is now facing potential headwinds. Key support at $460 is critical, and a break below this level could lead to further declines. Overall market conditions will heavily influence future performance.
Confidence Level
Potential Risks
Unforeseen macroeconomic events or changes in market sentiment could lead to volatility. A strong recovery in tech stocks could alter this outlook.