MSFT Trading Predictions
1 Day Prediction
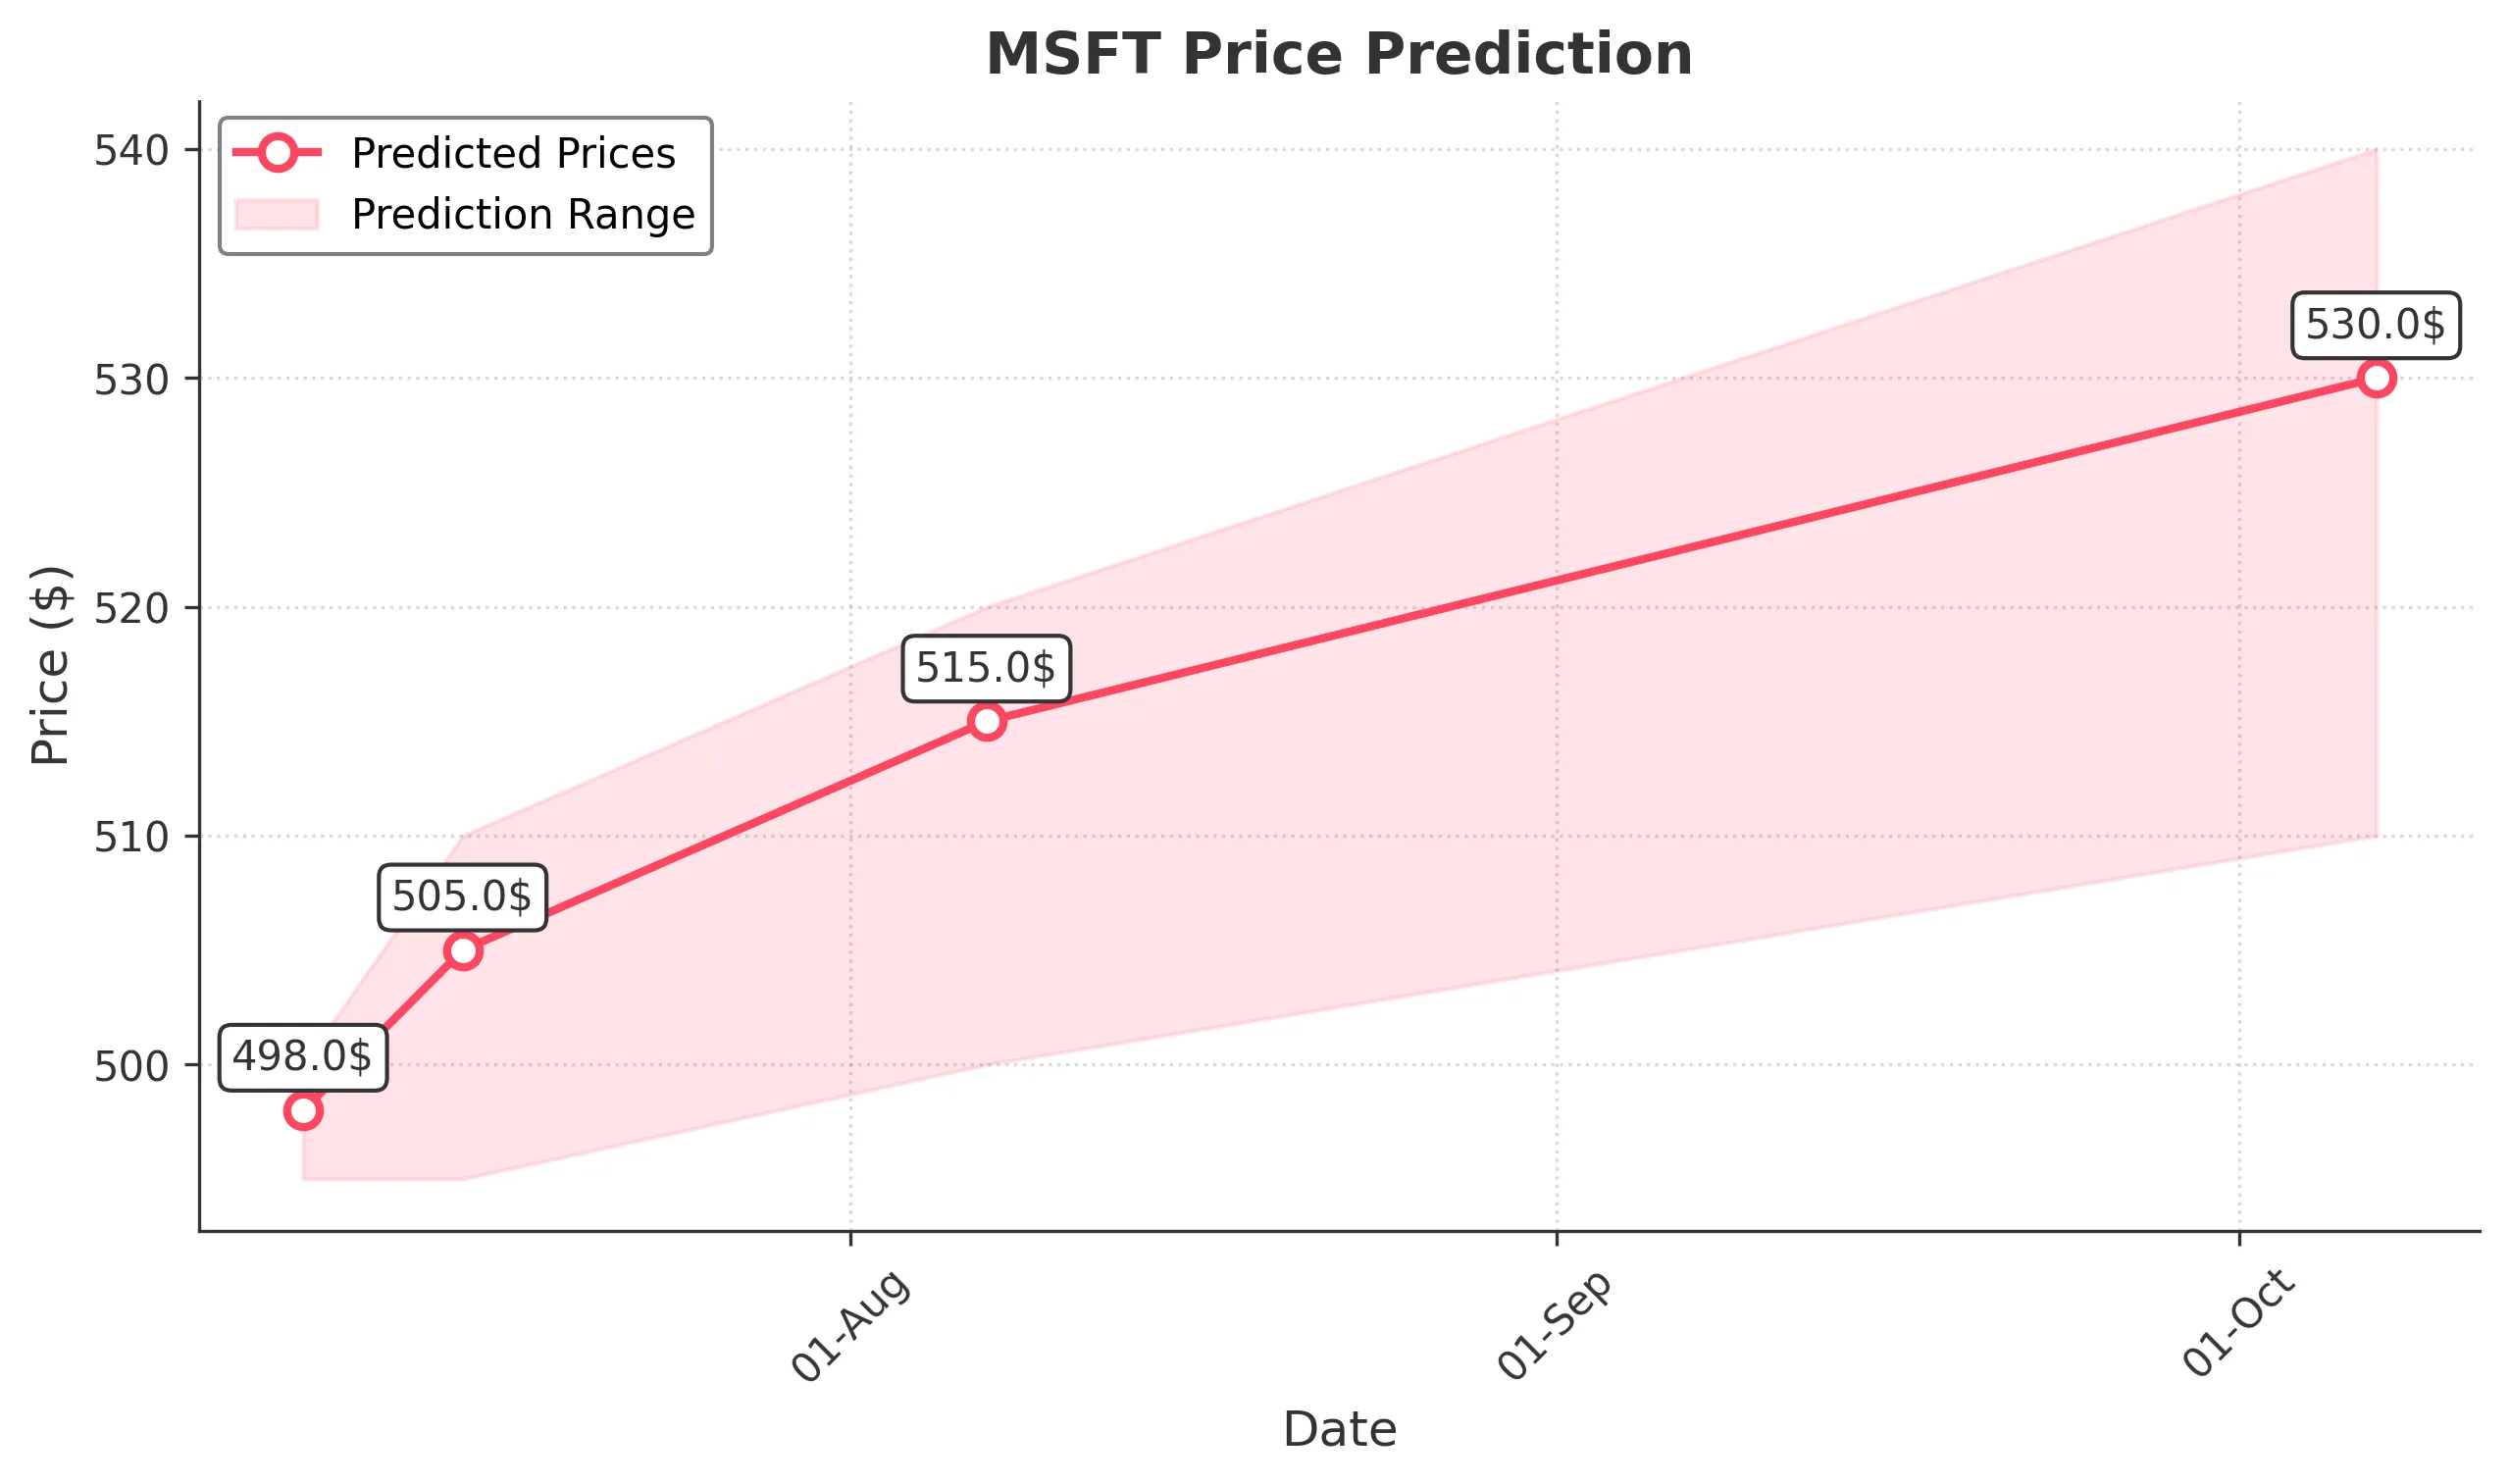
Target: July 8, 2025$498
$497.5
$500
$495
Description
The stock shows a slight bullish trend with a recent Doji candlestick indicating indecision. The RSI is near 60, suggesting room for upward movement. However, MACD is flattening, indicating potential consolidation. Volume is expected to be lower as traders await further direction.
Analysis
Over the past 3 months, MSFT has shown a bullish trend with significant upward momentum, reaching new highs. Key support is around 490, while resistance is near 500. The RSI indicates strength, but recent volatility suggests caution. Volume patterns show spikes during earnings, indicating investor interest.
Confidence Level
Potential Risks
Market sentiment could shift due to macroeconomic news or earnings reports, which may impact trading volume and price direction.
1 Week Prediction
Target: July 15, 2025$505
$500
$510
$495
Description
The bullish momentum is expected to continue, supported by a recent breakout above resistance at 500. The MACD is positive, and the RSI is still healthy. However, a potential pullback could occur if the market reacts negatively to external news.
Analysis
MSFT has maintained a strong upward trajectory, with key support at 490 and resistance at 500. The stock's performance has been bolstered by positive earnings and strong market sentiment. However, caution is warranted as the market may react to broader economic indicators.
Confidence Level
Potential Risks
External factors such as economic data releases or geopolitical events could lead to increased volatility and affect the stock's performance.
1 Month Prediction
Target: August 7, 2025$515
$510
$520
$500
Description
The stock is likely to continue its upward trend, supported by strong fundamentals and positive market sentiment. The RSI may approach overbought levels, indicating a potential correction. Watch for volume spikes that could signal reversals.
Analysis
MSFT has shown consistent growth, with a bullish trend supported by strong earnings. Key resistance is at 520, while support remains at 500. The stock's performance is influenced by broader market trends and economic indicators, which could introduce volatility.
Confidence Level
Potential Risks
Potential market corrections or profit-taking could lead to volatility. Additionally, any negative news could impact investor sentiment.
3 Months Prediction
Target: October 7, 2025$530
$525
$540
$510
Description
Long-term bullish sentiment is expected to prevail, driven by strong earnings and market demand. However, the stock may face resistance at 540, and any economic downturn could lead to a pullback. Monitor for changes in market sentiment.
Analysis
Over the past three months, MSFT has demonstrated strong performance, with key support at 510 and resistance at 540. The stock's upward trend is supported by positive earnings and market sentiment, but external factors could introduce volatility and affect future performance.
Confidence Level
Potential Risks
Economic uncertainties and potential market corrections could impact the stock's trajectory. Additionally, any negative news could lead to increased volatility.