MSFT Trading Predictions
1 Day Prediction
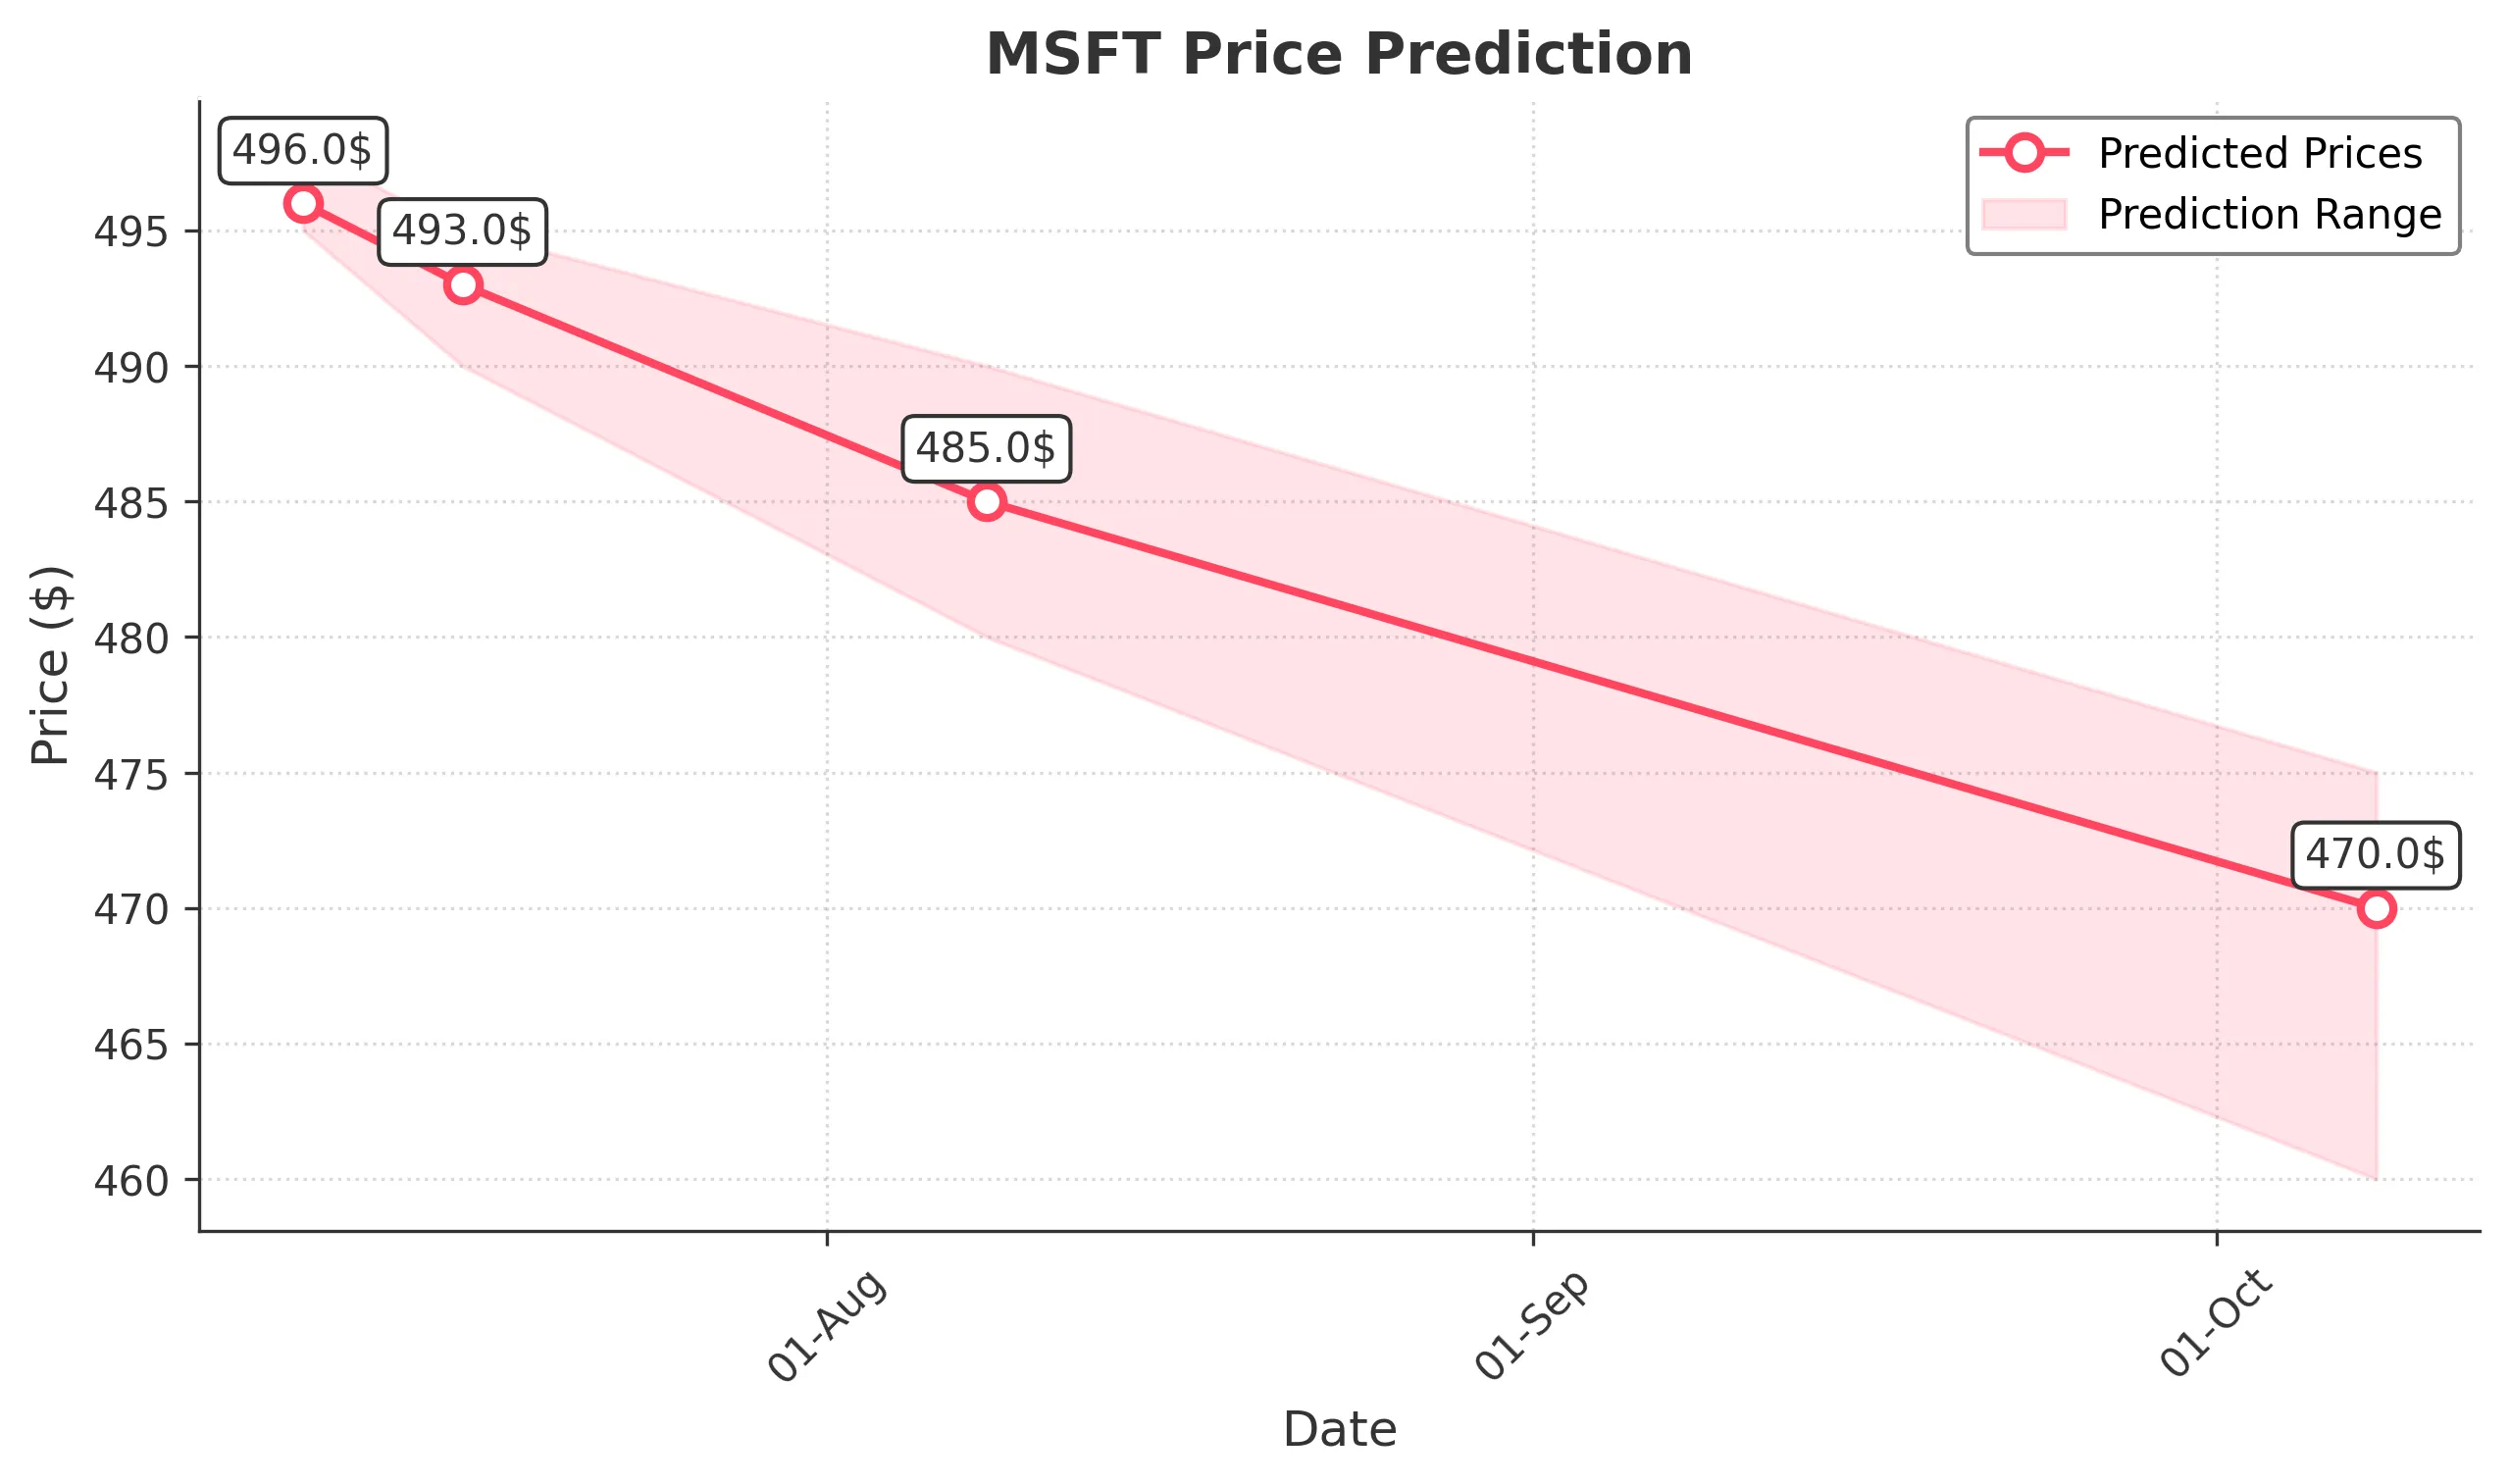
Target: July 9, 2025$496
$496.5
$498
$495
Description
The stock shows a slight bearish trend with recent lower highs. RSI indicates overbought conditions, suggesting a potential pullback. Volume has decreased, indicating weakening momentum. Expect a close around 496.0.
Analysis
Over the past 3 months, MSFT has shown a bullish trend with significant upward movement. Key resistance at 500. Recent candlestick patterns indicate indecision, and volume has been declining, suggesting potential weakness. The RSI is nearing overbought levels, indicating a possible correction.
Confidence Level
Potential Risks
Market volatility and external news could impact the prediction. A sudden bullish reversal is possible.
1 Week Prediction
Target: July 16, 2025$493
$494
$495
$490
Description
The stock is expected to continue its bearish trend with potential support at 490. The MACD shows a bearish crossover, and the RSI is declining. Anticipate a close around 493.0.
Analysis
MSFT has experienced a strong rally but is now facing resistance. The recent price action shows signs of consolidation. Key support is at 490, and the MACD indicates weakening momentum. Volume patterns suggest a lack of conviction in the current uptrend.
Confidence Level
Potential Risks
Unforeseen market events or earnings reports could lead to volatility, impacting the accuracy of this prediction.
1 Month Prediction
Target: August 8, 2025$485
$488
$490
$480
Description
Expect a continued bearish trend as the stock approaches key support levels. The Bollinger Bands indicate potential volatility, and the RSI suggests further downside. Close around 485.0 is likely.
Analysis
The stock has shown a strong bullish trend but is now facing resistance. The recent price action indicates a potential reversal. Key support at 480 is critical. The ATR suggests increasing volatility, and the RSI is declining, indicating potential further downside.
Confidence Level
Potential Risks
Market sentiment and macroeconomic factors could shift, leading to unexpected price movements.
3 Months Prediction
Target: October 8, 2025$470
$472
$475
$460
Description
The stock is expected to trend lower as it approaches significant support levels. The MACD indicates a bearish trend, and the RSI is in a downtrend. Anticipate a close around 470.0.
Analysis
Over the past three months, MSFT has shown a strong bullish trend but is now facing resistance. The stock's performance indicates a potential reversal, with key support at 460. The MACD and RSI suggest bearish momentum, and external factors could significantly impact future performance.
Confidence Level
Potential Risks
Long-term predictions are subject to greater uncertainty due to potential market shifts and economic changes.