MSFT Trading Predictions
1 Day Prediction
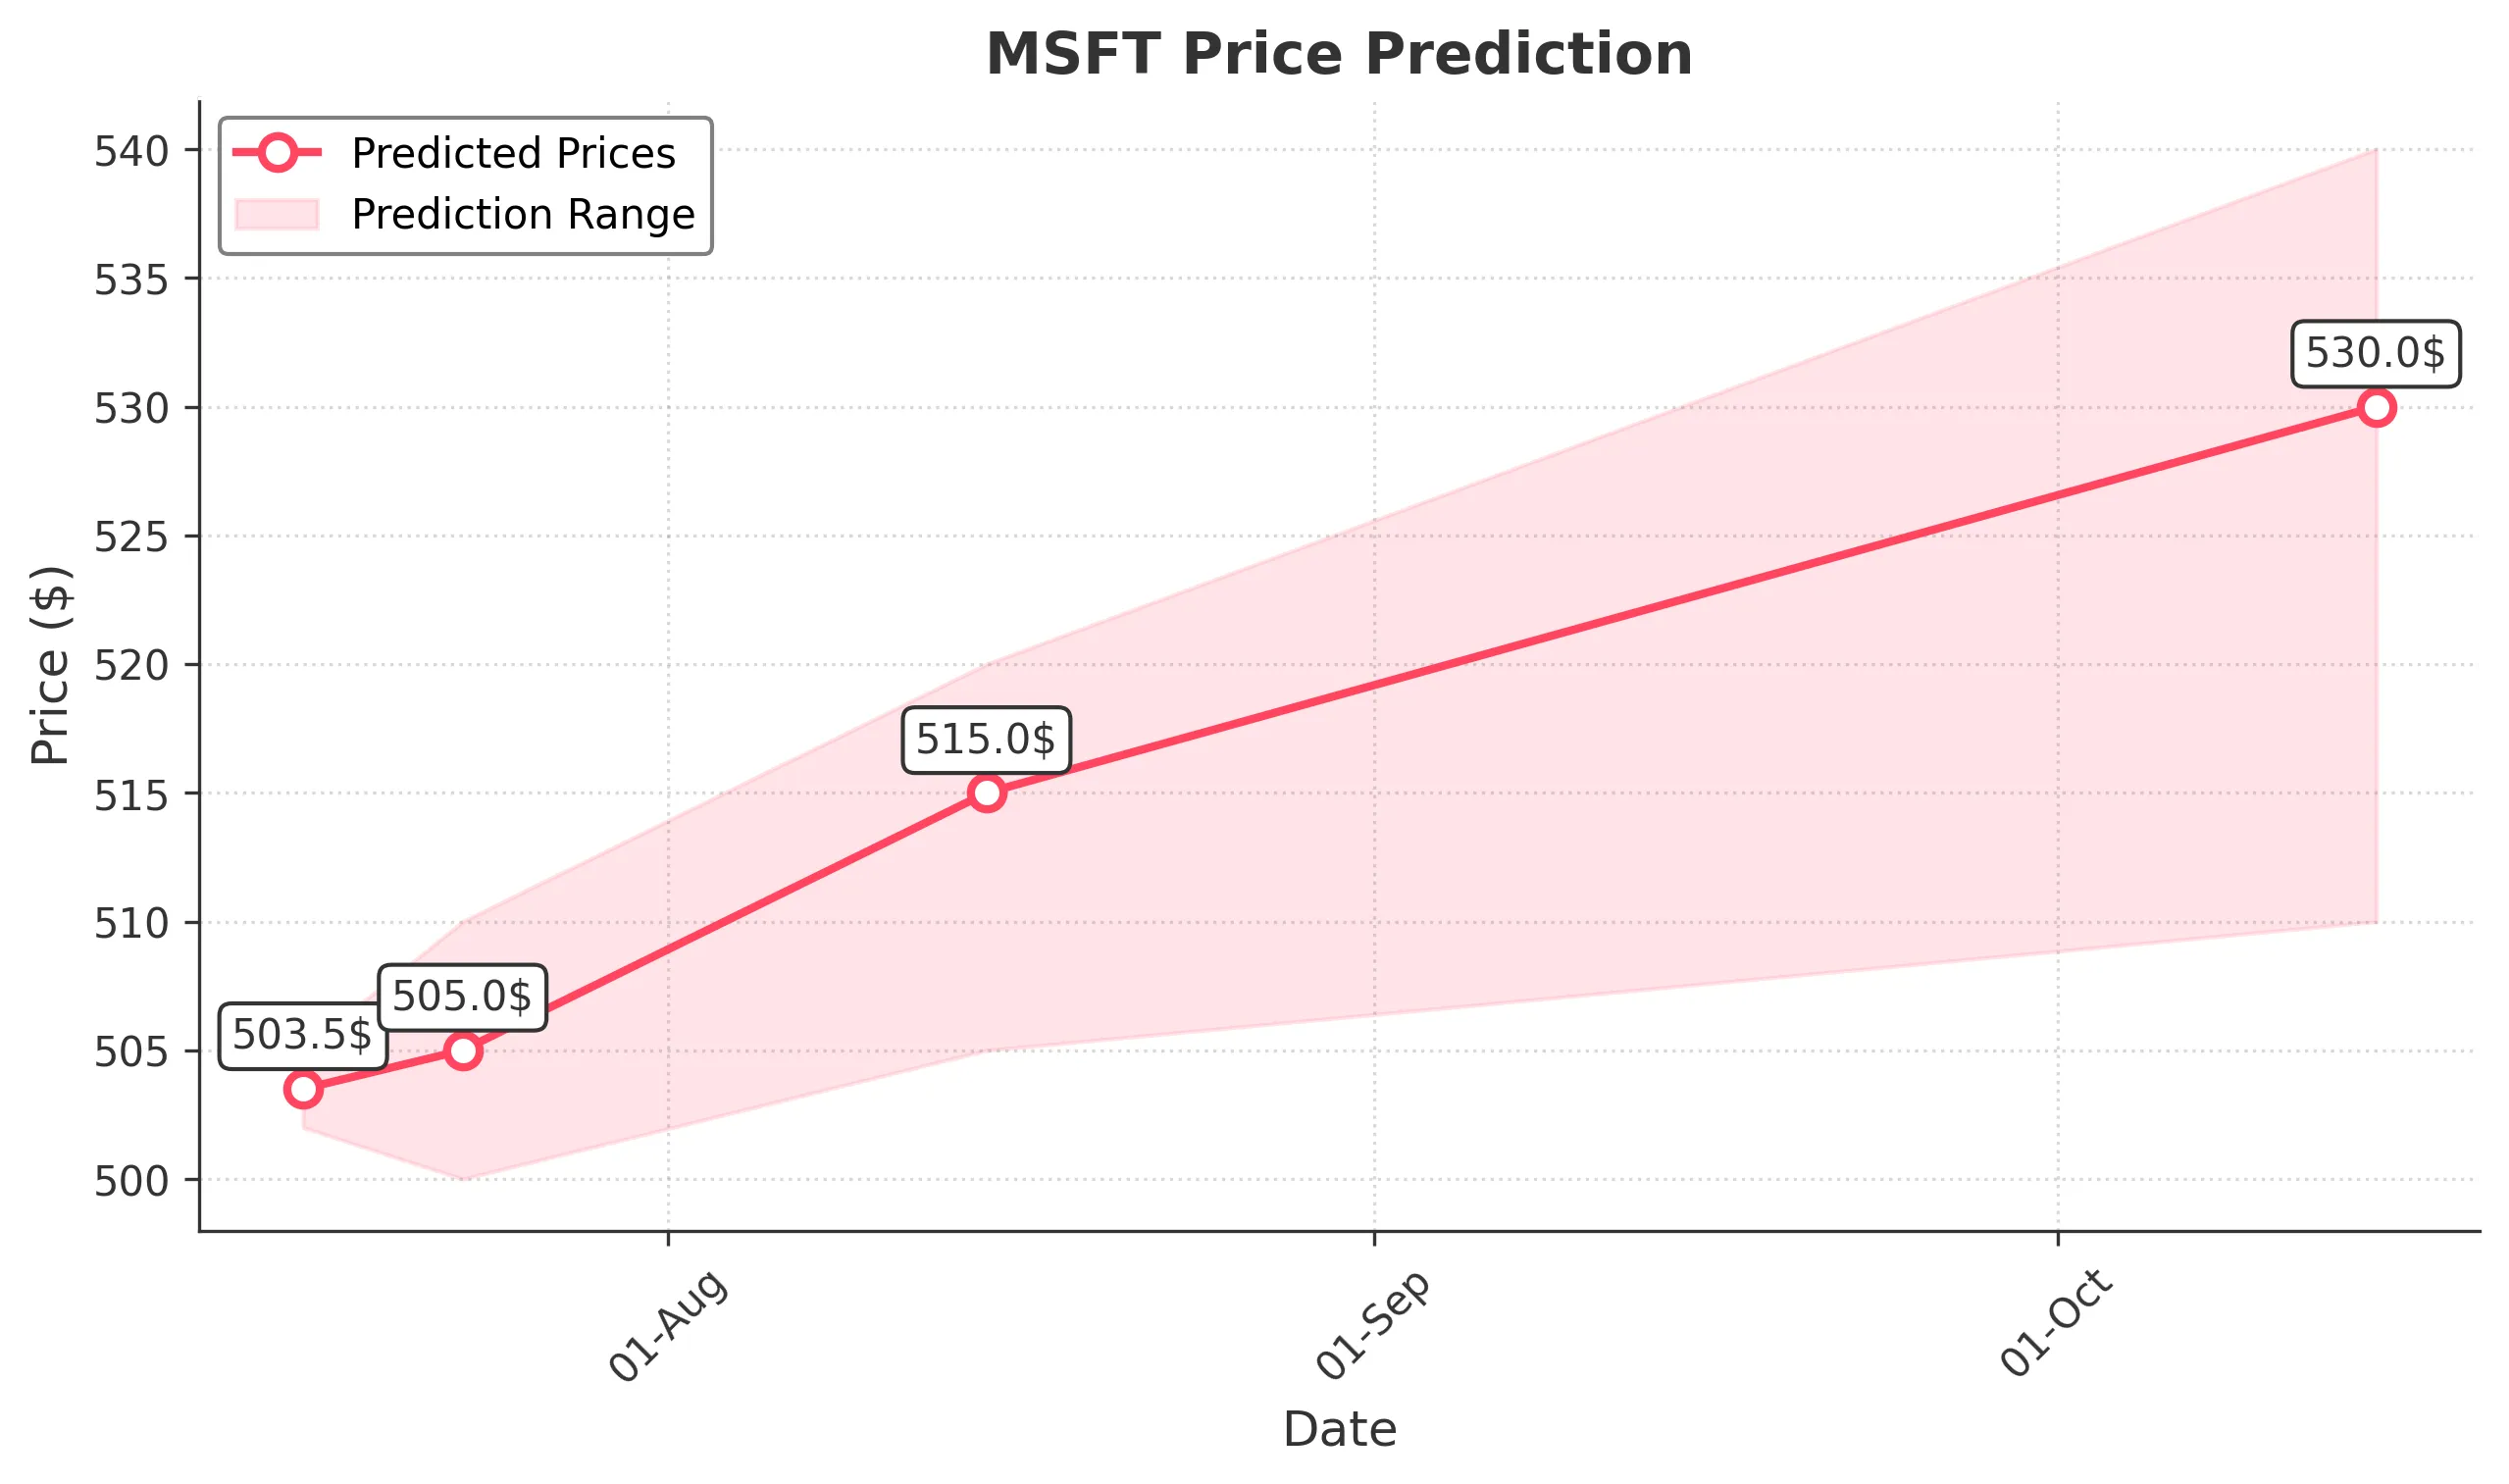
Target: July 16, 2025$503.5
$503
$505
$502
Description
The stock shows a slight bullish trend with a recent Doji candlestick indicating indecision. The RSI is around 55, suggesting room for upward movement. However, MACD is flattening, indicating potential consolidation.
Analysis
Over the past 3 months, MSFT has shown a bullish trend with significant upward momentum, reaching a peak of 503.5. Key support is at 500, while resistance is at 505. Volume has been consistent, with spikes during earnings announcements. The RSI indicates a healthy trend, but MACD divergence suggests caution.
Confidence Level
Potential Risks
Market volatility and external news could impact the price. A bearish reversal is possible if the price fails to hold above 503.
1 Week Prediction
Target: July 23, 2025$505
$504
$510
$500
Description
The stock is expected to continue its upward trajectory, supported by a bullish engulfing pattern. The MACD is showing a bullish crossover, and the RSI remains healthy. However, a pullback could occur if it hits resistance at 510.
Analysis
MSFT has maintained a bullish trend, with recent highs indicating strong buying interest. Support is at 500, while resistance is at 510. The stock's volatility is moderate, and the ATR suggests potential for price swings. Overall, the sentiment remains positive, but caution is warranted.
Confidence Level
Potential Risks
Potential market corrections or negative news could lead to a price drop. Watch for volume spikes that may indicate reversals.
1 Month Prediction
Target: August 15, 2025$515
$510
$520
$505
Description
The stock is projected to rise as bullish momentum continues. The Fibonacci retracement levels suggest a target of 515. The RSI is approaching overbought territory, indicating caution for potential pullbacks.
Analysis
MSFT has shown strong performance, with a clear upward trend. Key support is at 505, while resistance is at 520. The stock's volume has been increasing, indicating strong interest. Technical indicators suggest continued bullish momentum, but overbought conditions could lead to corrections.
Confidence Level
Potential Risks
Market sentiment can shift quickly, and any negative macroeconomic news could impact the stock's performance. Watch for signs of exhaustion in the rally.
3 Months Prediction
Target: October 15, 2025$530
$525
$540
$510
Description
Long-term bullish outlook supported by strong fundamentals and technical indicators. The stock is expected to break through resistance levels, but overbought conditions may lead to volatility.
Analysis
MSFT has been on a strong upward trend, with key support at 510 and resistance at 540. The stock's performance has been bolstered by positive earnings and strong market sentiment. However, potential macroeconomic headwinds could introduce volatility in the coming months.
Confidence Level
Potential Risks
Economic conditions, interest rates, and geopolitical events could impact the stock's trajectory. A significant market correction could reverse the trend.