MSFT Trading Predictions
1 Day Prediction
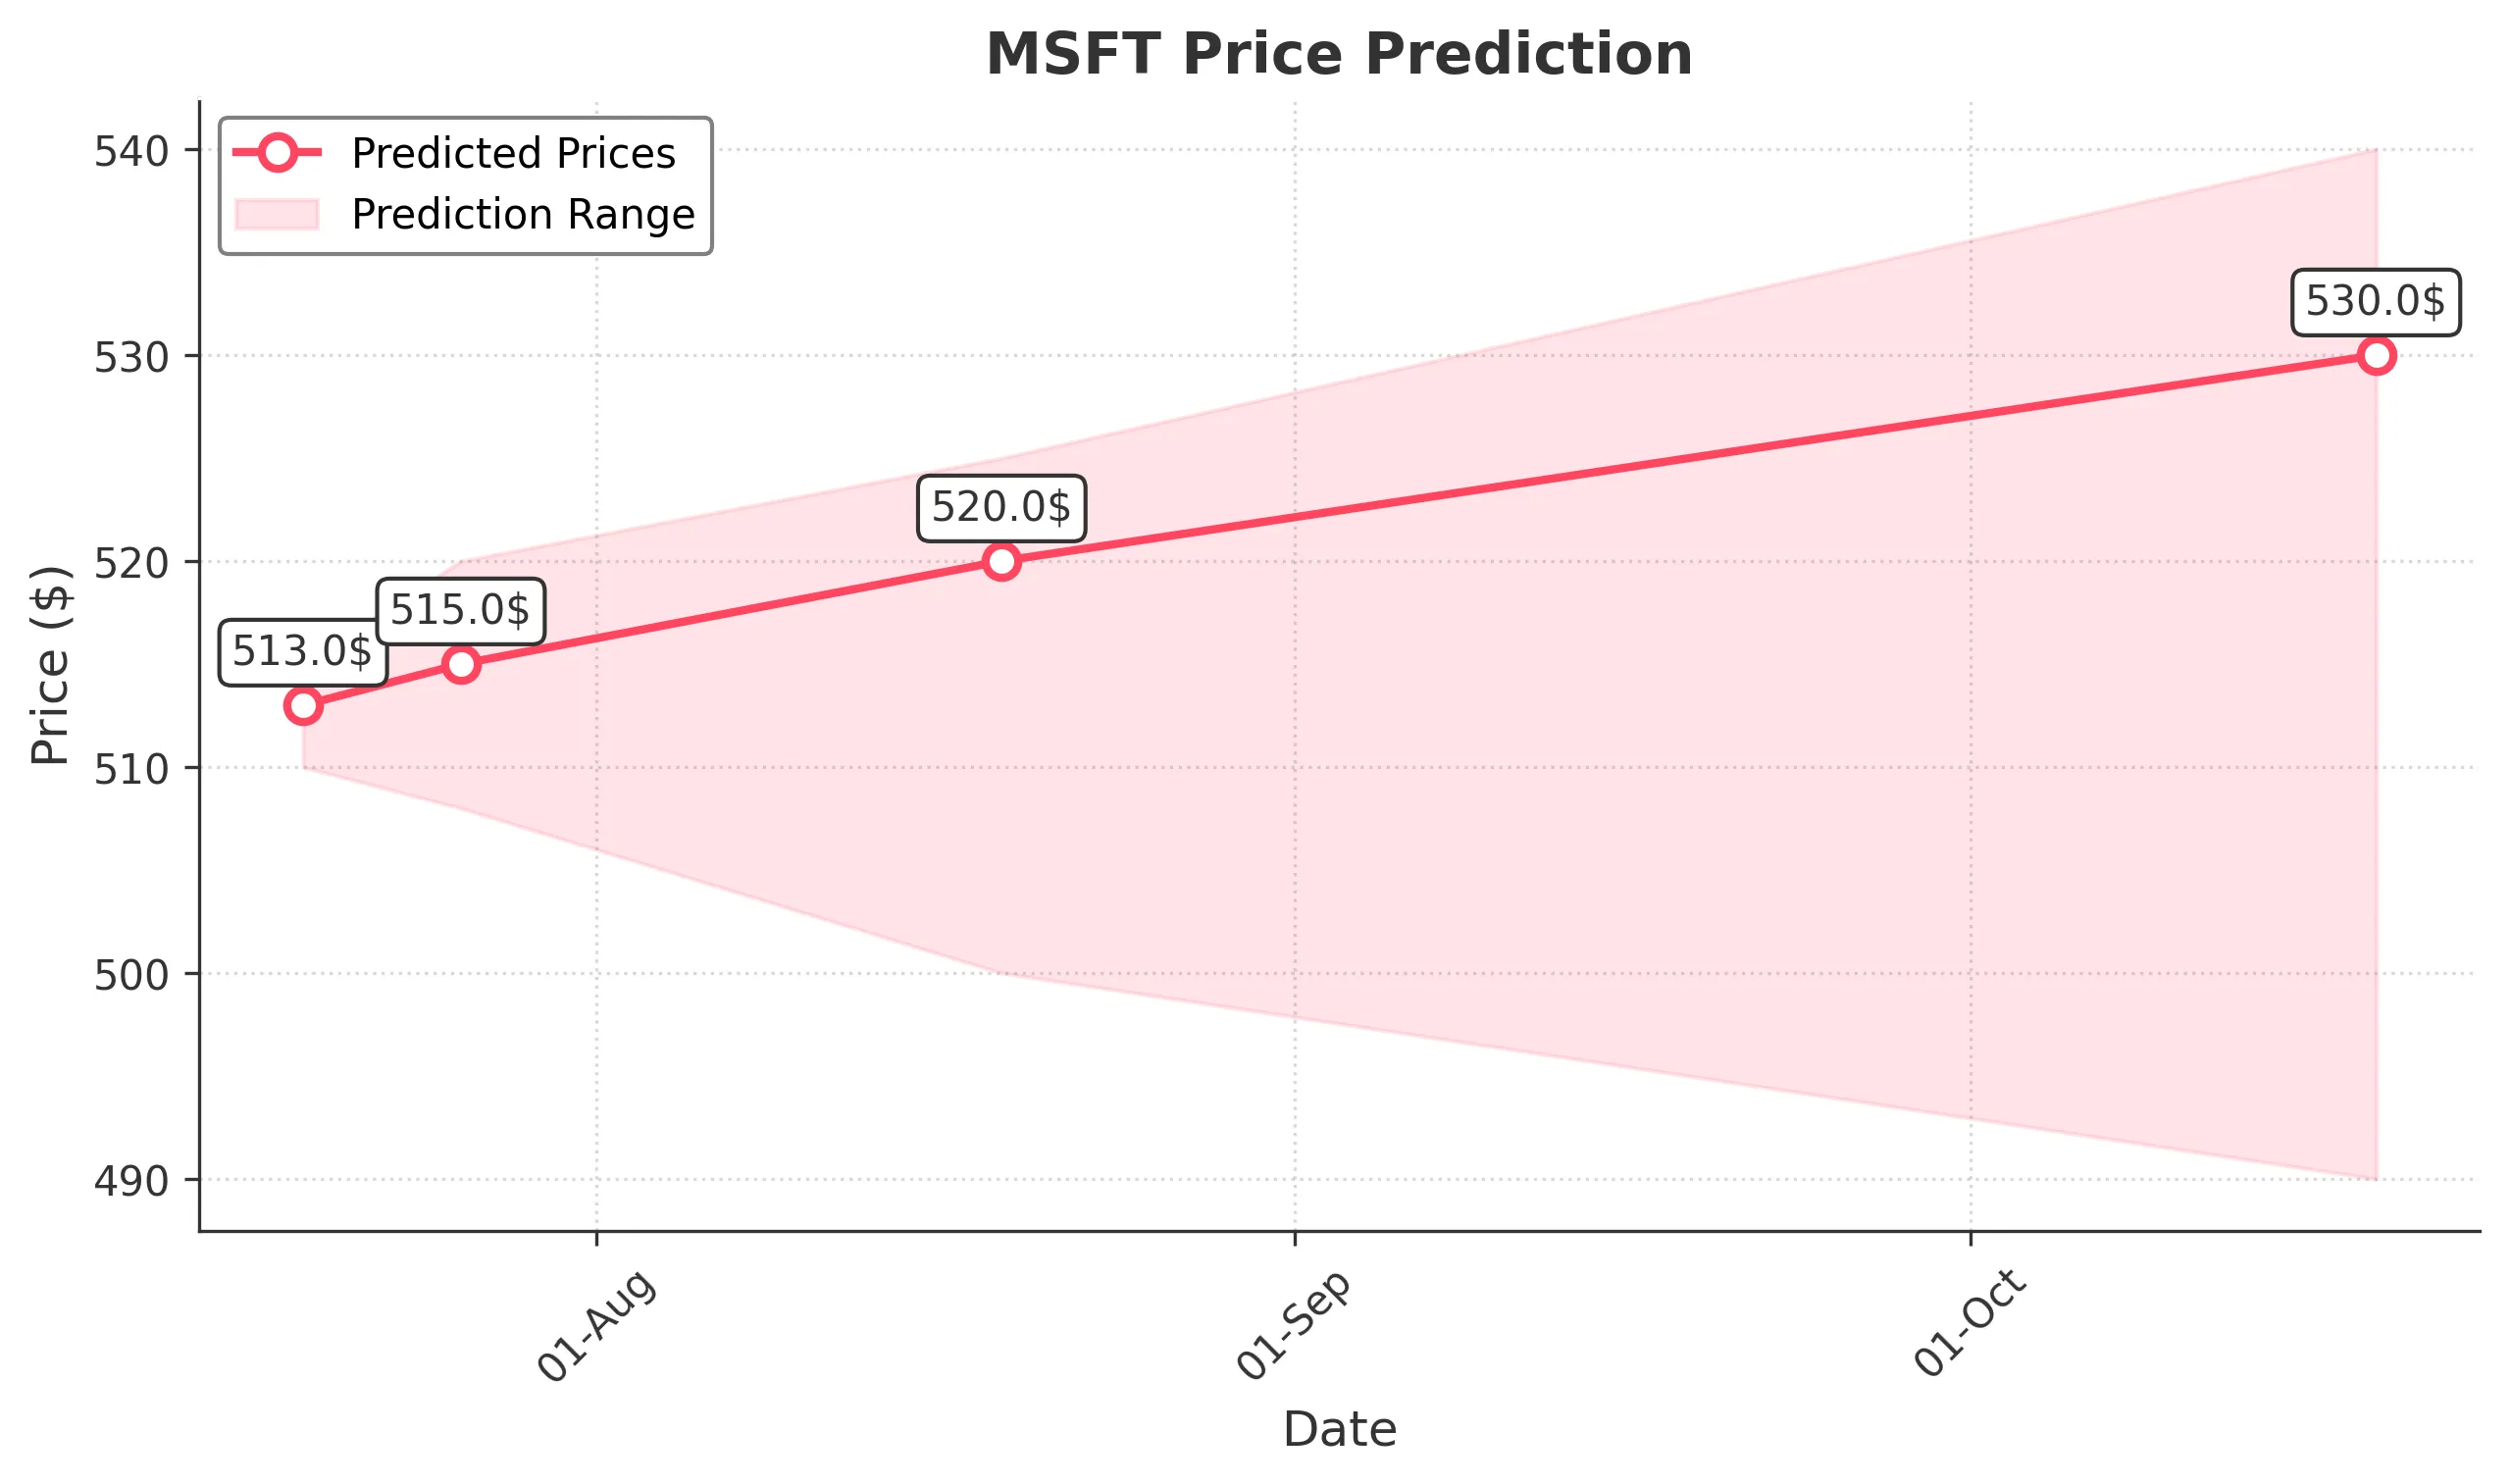
Target: July 19, 2025$513
$511.5
$515
$510
Description
The stock shows bullish momentum with a recent close above key resistance at 511. The RSI is nearing overbought levels, suggesting a potential pullback. However, strong volume indicates continued interest. Expect slight fluctuations.
Analysis
MSFT has been in a bullish trend, recently breaking above 511 resistance. The MACD is positive, and the ATR indicates moderate volatility. Volume spikes on up days suggest strong buying interest. However, overbought conditions may lead to short-term corrections.
Confidence Level
Potential Risks
Potential for a pullback if RSI exceeds 70, and market sentiment could shift due to external news.
1 Week Prediction
Target: July 26, 2025$515
$512
$520
$508
Description
The bullish trend is expected to continue, with the stock likely to test the 520 resistance level. However, the RSI indicates potential overbought conditions, which could lead to volatility. Watch for volume trends for confirmation.
Analysis
The stock has shown strong upward movement, with significant support at 508. The MACD remains bullish, and the Bollinger Bands suggest potential for further price expansion. However, caution is warranted as the RSI approaches overbought territory.
Confidence Level
Potential Risks
Market corrections or negative news could impact momentum, leading to a possible drop below 510.
1 Month Prediction
Target: August 19, 2025$520
$515
$525
$500
Description
Expect continued bullish momentum, with the stock likely to reach 520. However, the potential for a pullback exists if the RSI remains high. Volume trends will be crucial in confirming the strength of this upward movement.
Analysis
MSFT has maintained a strong bullish trend, with key support at 500. The MACD remains positive, and the ATR indicates increasing volatility. However, the stock is approaching overbought levels, which could trigger profit-taking.
Confidence Level
Potential Risks
External market factors or earnings reports could lead to unexpected volatility, impacting the price direction.
3 Months Prediction
Target: October 19, 2025$530
$525
$540
$490
Description
Long-term bullish outlook with potential to reach 530. However, market corrections could occur, especially if economic indicators shift. Watch for volume trends and macroeconomic news that could influence market sentiment.
Analysis
The stock has shown resilience with a strong upward trend. Key support is at 490, while resistance is at 540. The MACD is bullish, but the RSI indicates potential overbought conditions. External economic factors could introduce volatility.
Confidence Level
Potential Risks
Economic downturns or changes in market sentiment could lead to significant price corrections, impacting the forecast.