MSFT Trading Predictions
1 Day Prediction
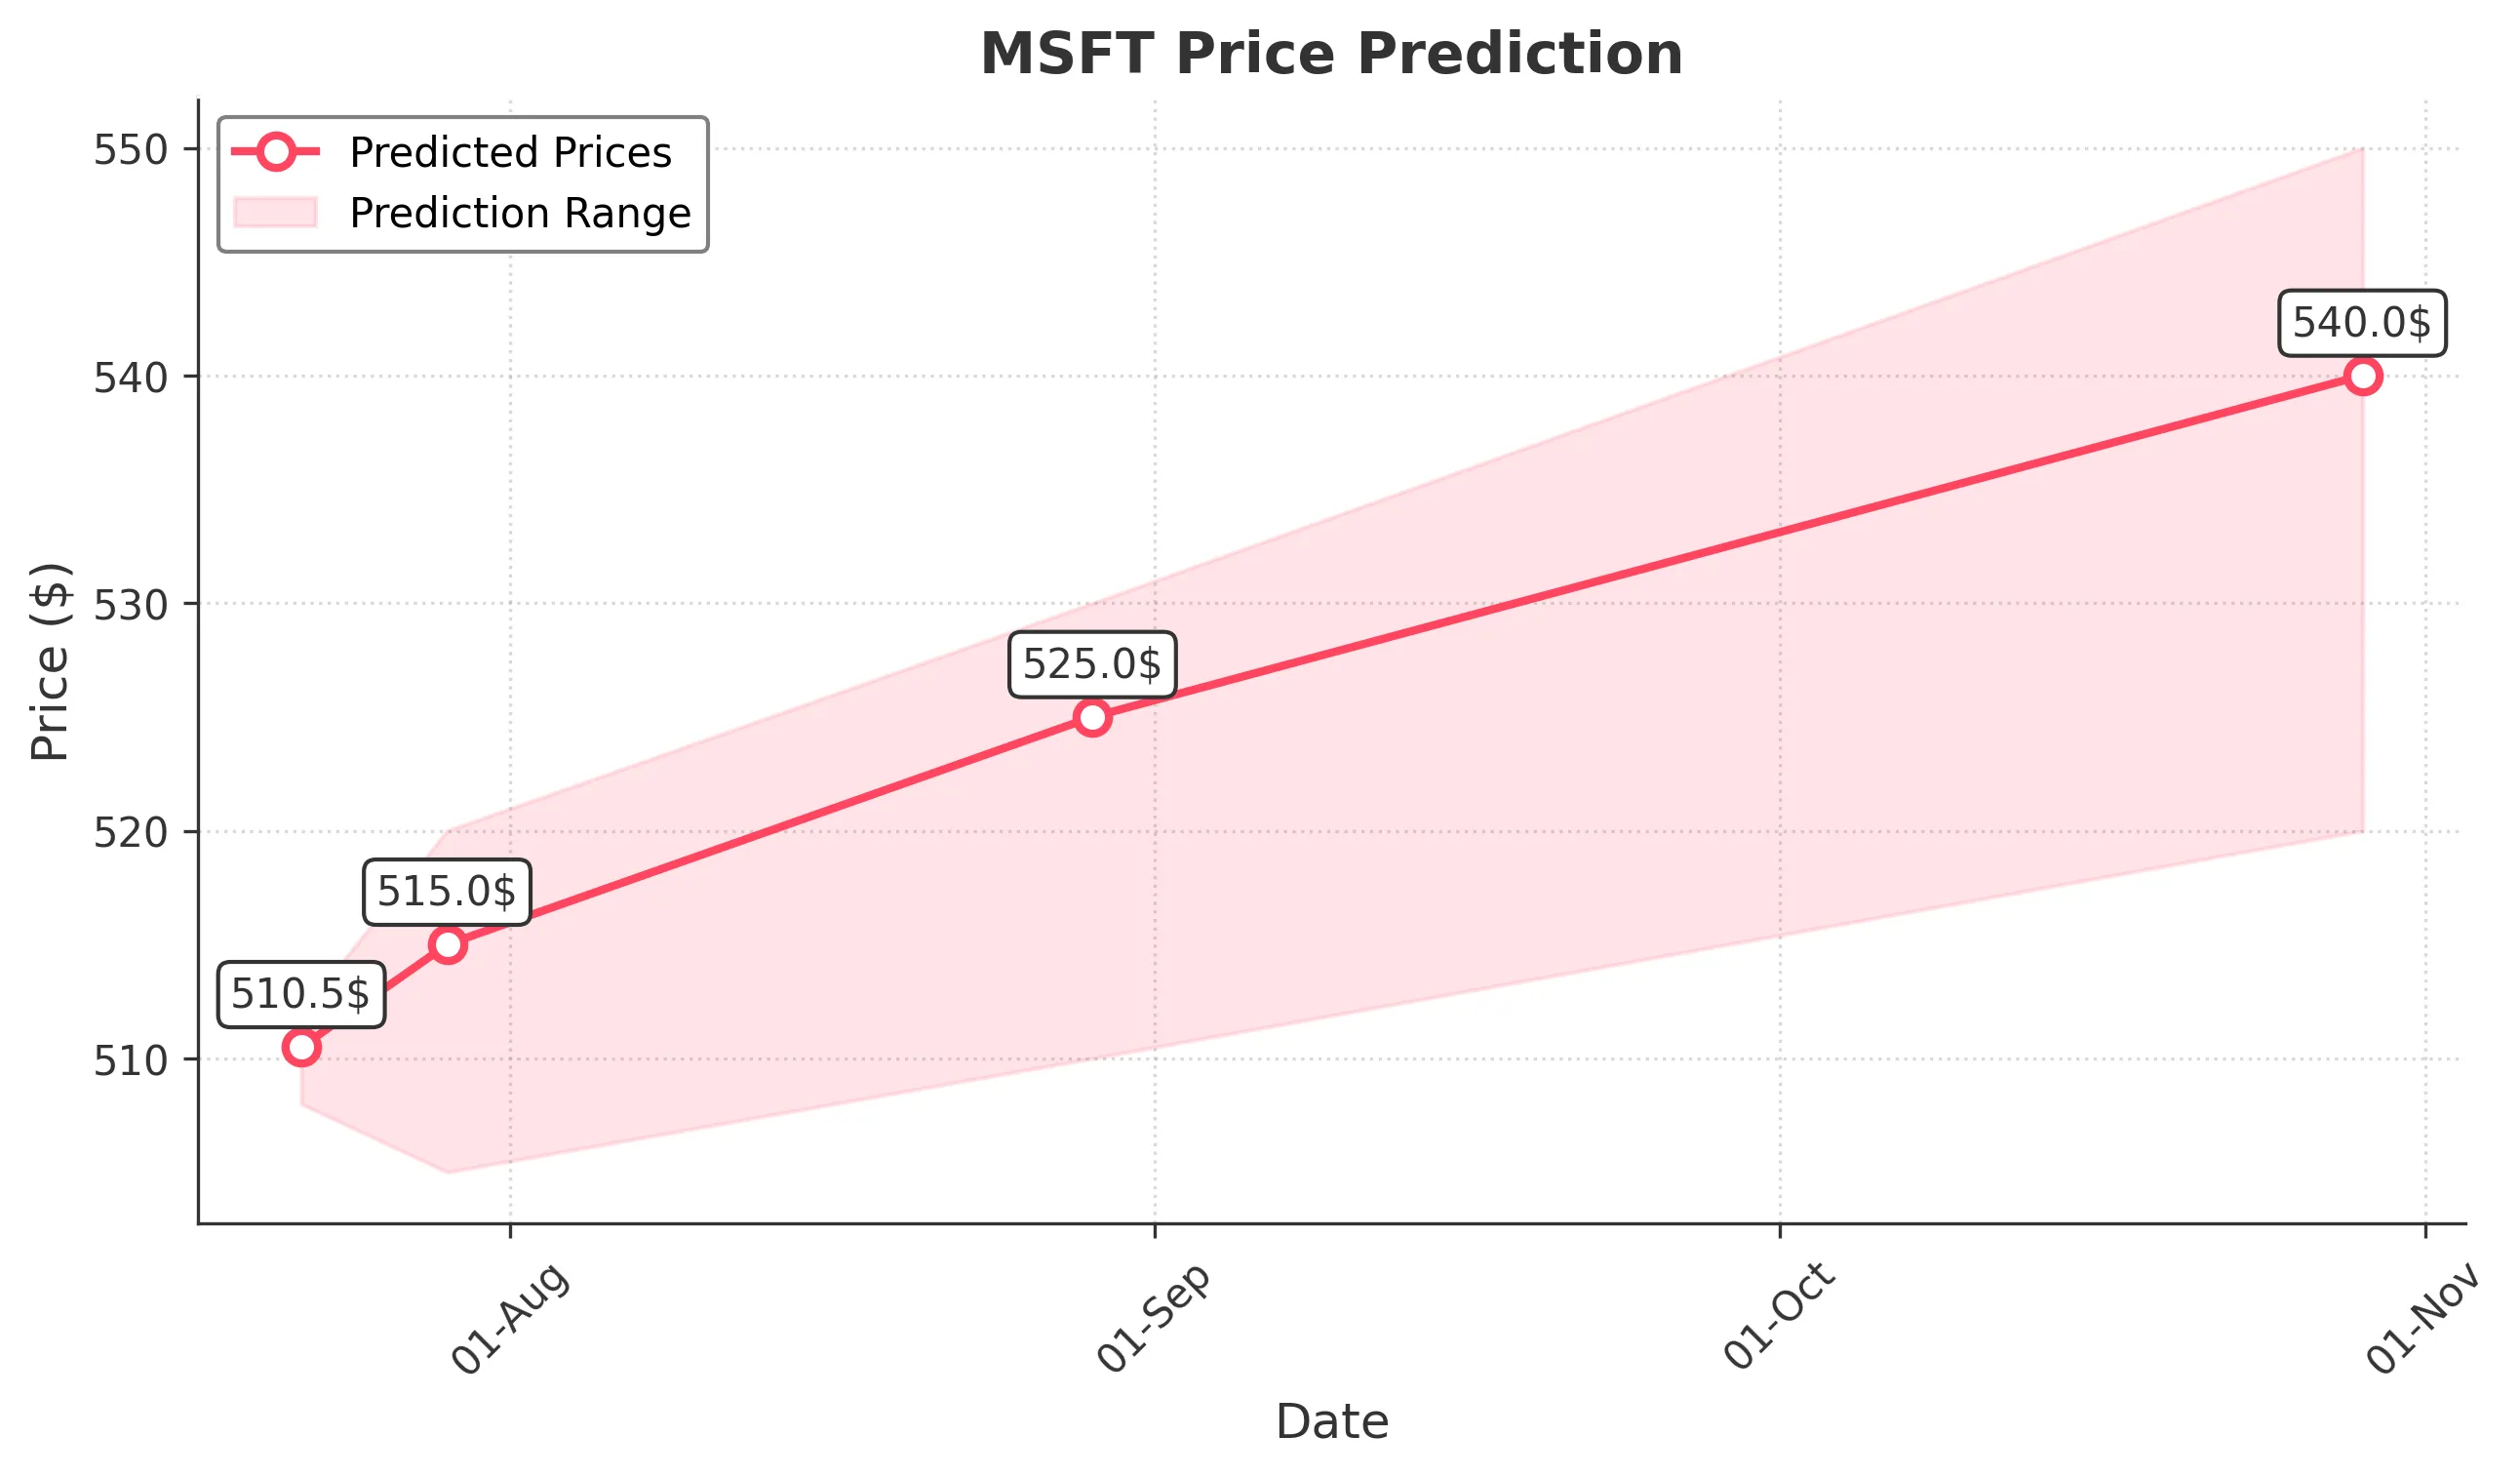
Target: July 22, 2025$510.5
$509.5
$512
$508
Description
The stock shows bullish momentum with a recent close above key resistance at 510. The RSI is nearing overbought levels, suggesting potential for a pullback. However, strong volume indicates continued interest. Watch for a possible Doji pattern indicating indecision.
Analysis
MSFT has shown a strong bullish trend over the past three months, with significant support at 500 and resistance around 510. The recent volume spikes indicate strong buying interest. Technical indicators like MACD are bullish, but RSI suggests caution due to overbought conditions.
Confidence Level
Potential Risks
Potential reversal if market sentiment shifts or if macroeconomic news impacts tech stocks.
1 Week Prediction
Target: July 29, 2025$515
$511
$520
$505
Description
The upward trend is expected to continue, with the stock likely to test the 520 resistance level. The MACD remains bullish, and the recent candlestick patterns suggest a continuation of the upward momentum. However, watch for potential profit-taking.
Analysis
Over the past three months, MSFT has consistently closed above its moving averages, indicating a strong bullish trend. Key support is at 500, while resistance is at 520. Volume patterns show increased buying interest, but the RSI indicates potential overbought conditions.
Confidence Level
Potential Risks
Market volatility and external economic factors could lead to unexpected price movements.
1 Month Prediction
Target: August 29, 2025$525
$520
$530
$510
Description
The stock is expected to reach new highs as it breaks through resistance levels. The bullish trend is supported by strong fundamentals and positive market sentiment. However, the RSI indicates potential overbought conditions, suggesting caution.
Analysis
MSFT has shown a strong upward trajectory, with significant support at 510 and resistance at 520. The MACD and moving averages indicate bullish momentum, but the RSI suggests caution due to overbought conditions. Volume remains strong, indicating continued interest.
Confidence Level
Potential Risks
Any negative news or earnings reports could lead to a sharp decline.
3 Months Prediction
Target: October 29, 2025$540
$525
$550
$520
Description
Long-term bullish sentiment is expected to drive the stock higher, with potential to reach 550. However, the market may experience corrections along the way. Watch for key economic indicators that could impact tech stocks.
Analysis
The overall trend for MSFT remains bullish, with key support at 520 and resistance at 550. The stock has shown resilience, but external factors such as economic data and market sentiment could impact performance. The RSI indicates potential overbought conditions, suggesting caution.
Confidence Level
Potential Risks
Market corrections and economic uncertainties could lead to volatility and price declines.