MSFT Trading Predictions
1 Day Prediction
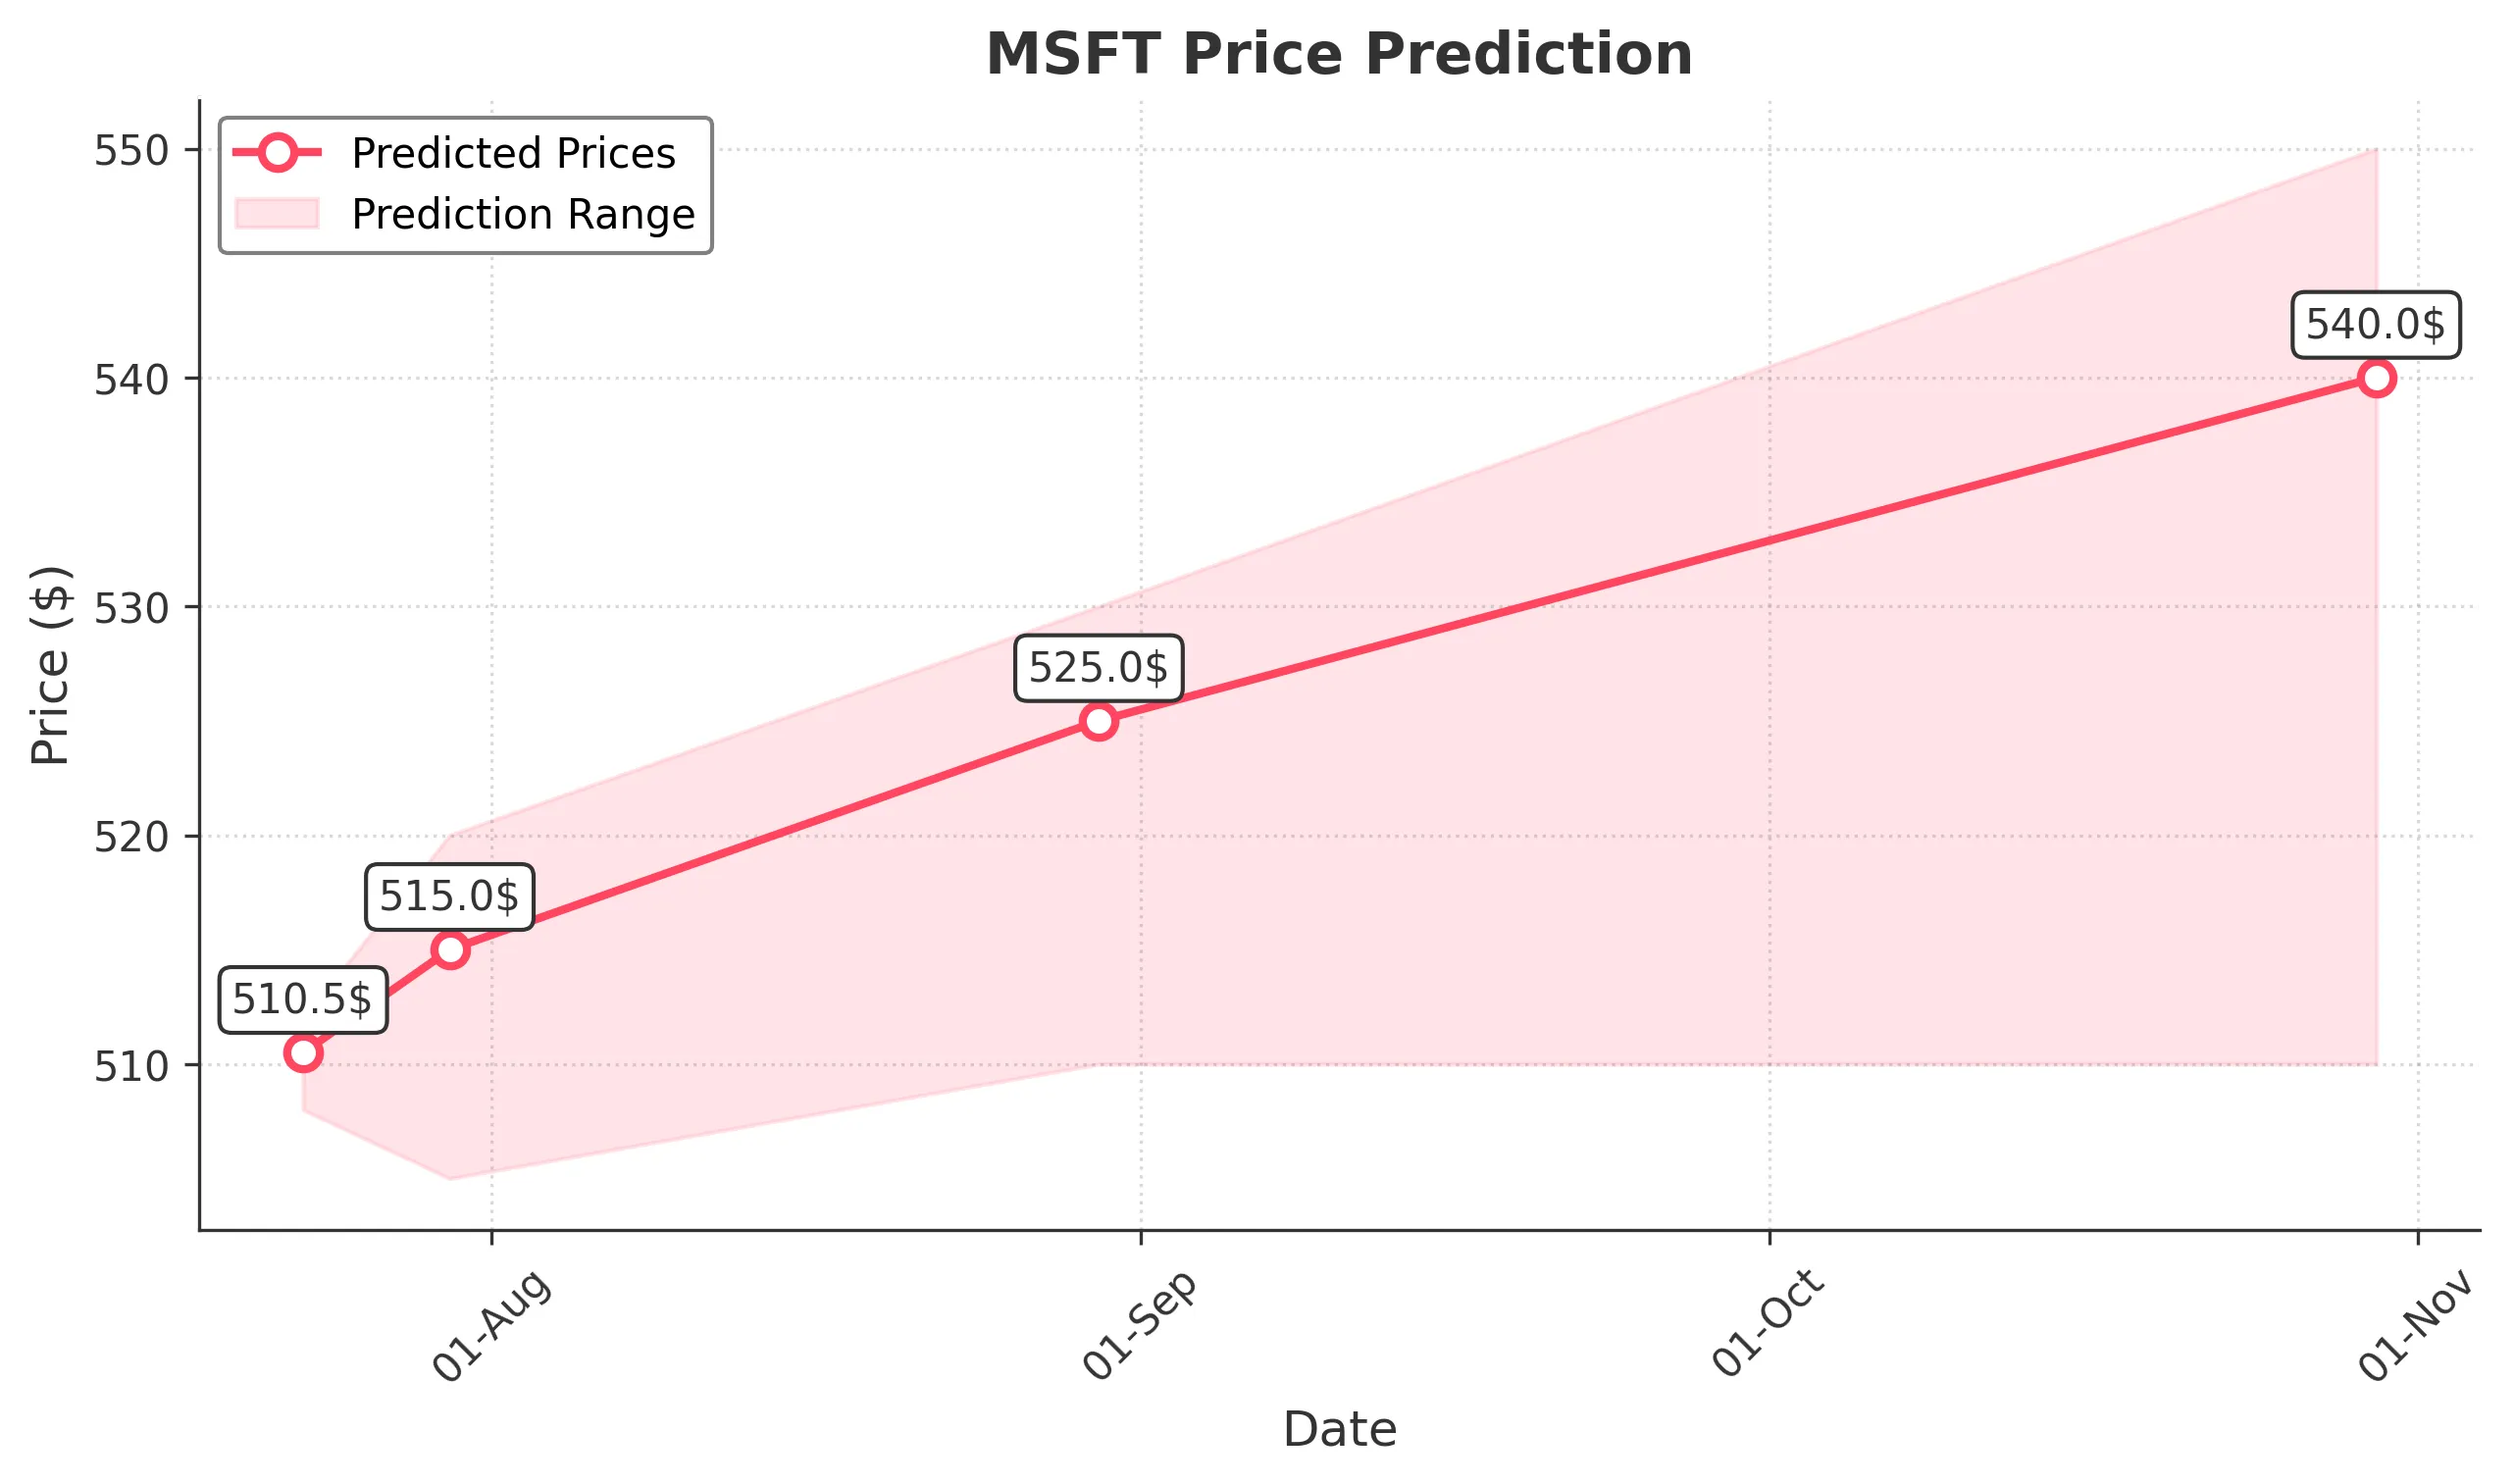
Target: July 23, 2025$510.5
$510
$512
$508
Description
The stock shows a slight bullish trend with a recent Doji pattern indicating indecision. The RSI is near 60, suggesting room for upward movement. However, MACD is flattening, indicating potential consolidation. Volume is expected to be moderate.
Analysis
Over the past 3 months, MSFT has shown a strong bullish trend, with significant support at $500 and resistance around $515. The recent price action indicates a possible consolidation phase. Technical indicators like the MACD and RSI suggest a healthy upward momentum, but caution is warranted due to potential market corrections.
Confidence Level
Potential Risks
Potential market volatility and external news could impact the price direction.
1 Week Prediction
Target: July 30, 2025$515
$511
$520
$505
Description
The stock is expected to continue its upward trajectory, supported by a bullish engulfing pattern. The MACD is positive, and the RSI is approaching overbought territory, indicating strong buying interest. However, a pullback could occur if the RSI exceeds 70.
Analysis
MSFT has maintained a bullish trend with key support at $500 and resistance at $520. The recent price movements indicate strong buying pressure, with volume spikes confirming this trend. Technical indicators suggest continued upward momentum, but caution is advised as the stock approaches overbought levels.
Confidence Level
Potential Risks
Market sentiment could shift due to macroeconomic factors, affecting the bullish outlook.
1 Month Prediction
Target: August 30, 2025$525
$520
$530
$510
Description
The stock is projected to reach new highs, driven by strong earnings reports and positive market sentiment. The Fibonacci retracement levels indicate support at $510, while the MACD remains bullish. However, overbought conditions may lead to short-term corrections.
Analysis
MSFT's performance over the last three months has been robust, with a clear bullish trend. Key support levels are at $510, while resistance is seen at $530. The stock's upward momentum is supported by strong technical indicators, but potential market corrections should be monitored closely.
Confidence Level
Potential Risks
Earnings surprises or geopolitical events could lead to unexpected volatility.
3 Months Prediction
Target: October 30, 2025$540
$530
$550
$510
Description
Long-term bullish sentiment is expected to prevail, with strong fundamentals supporting growth. The stock may face resistance at $550, but continued positive earnings and market conditions could push it higher. Watch for potential corrections as the RSI approaches overbought levels.
Analysis
MSFT has shown a strong upward trend over the past three months, with significant support at $510 and resistance at $550. The stock's performance is bolstered by positive technical indicators, but potential market volatility and external factors could impact future price movements.
Confidence Level
Potential Risks
Long-term predictions are subject to macroeconomic changes and market sentiment shifts.