MSFT Trading Predictions
1 Day Prediction
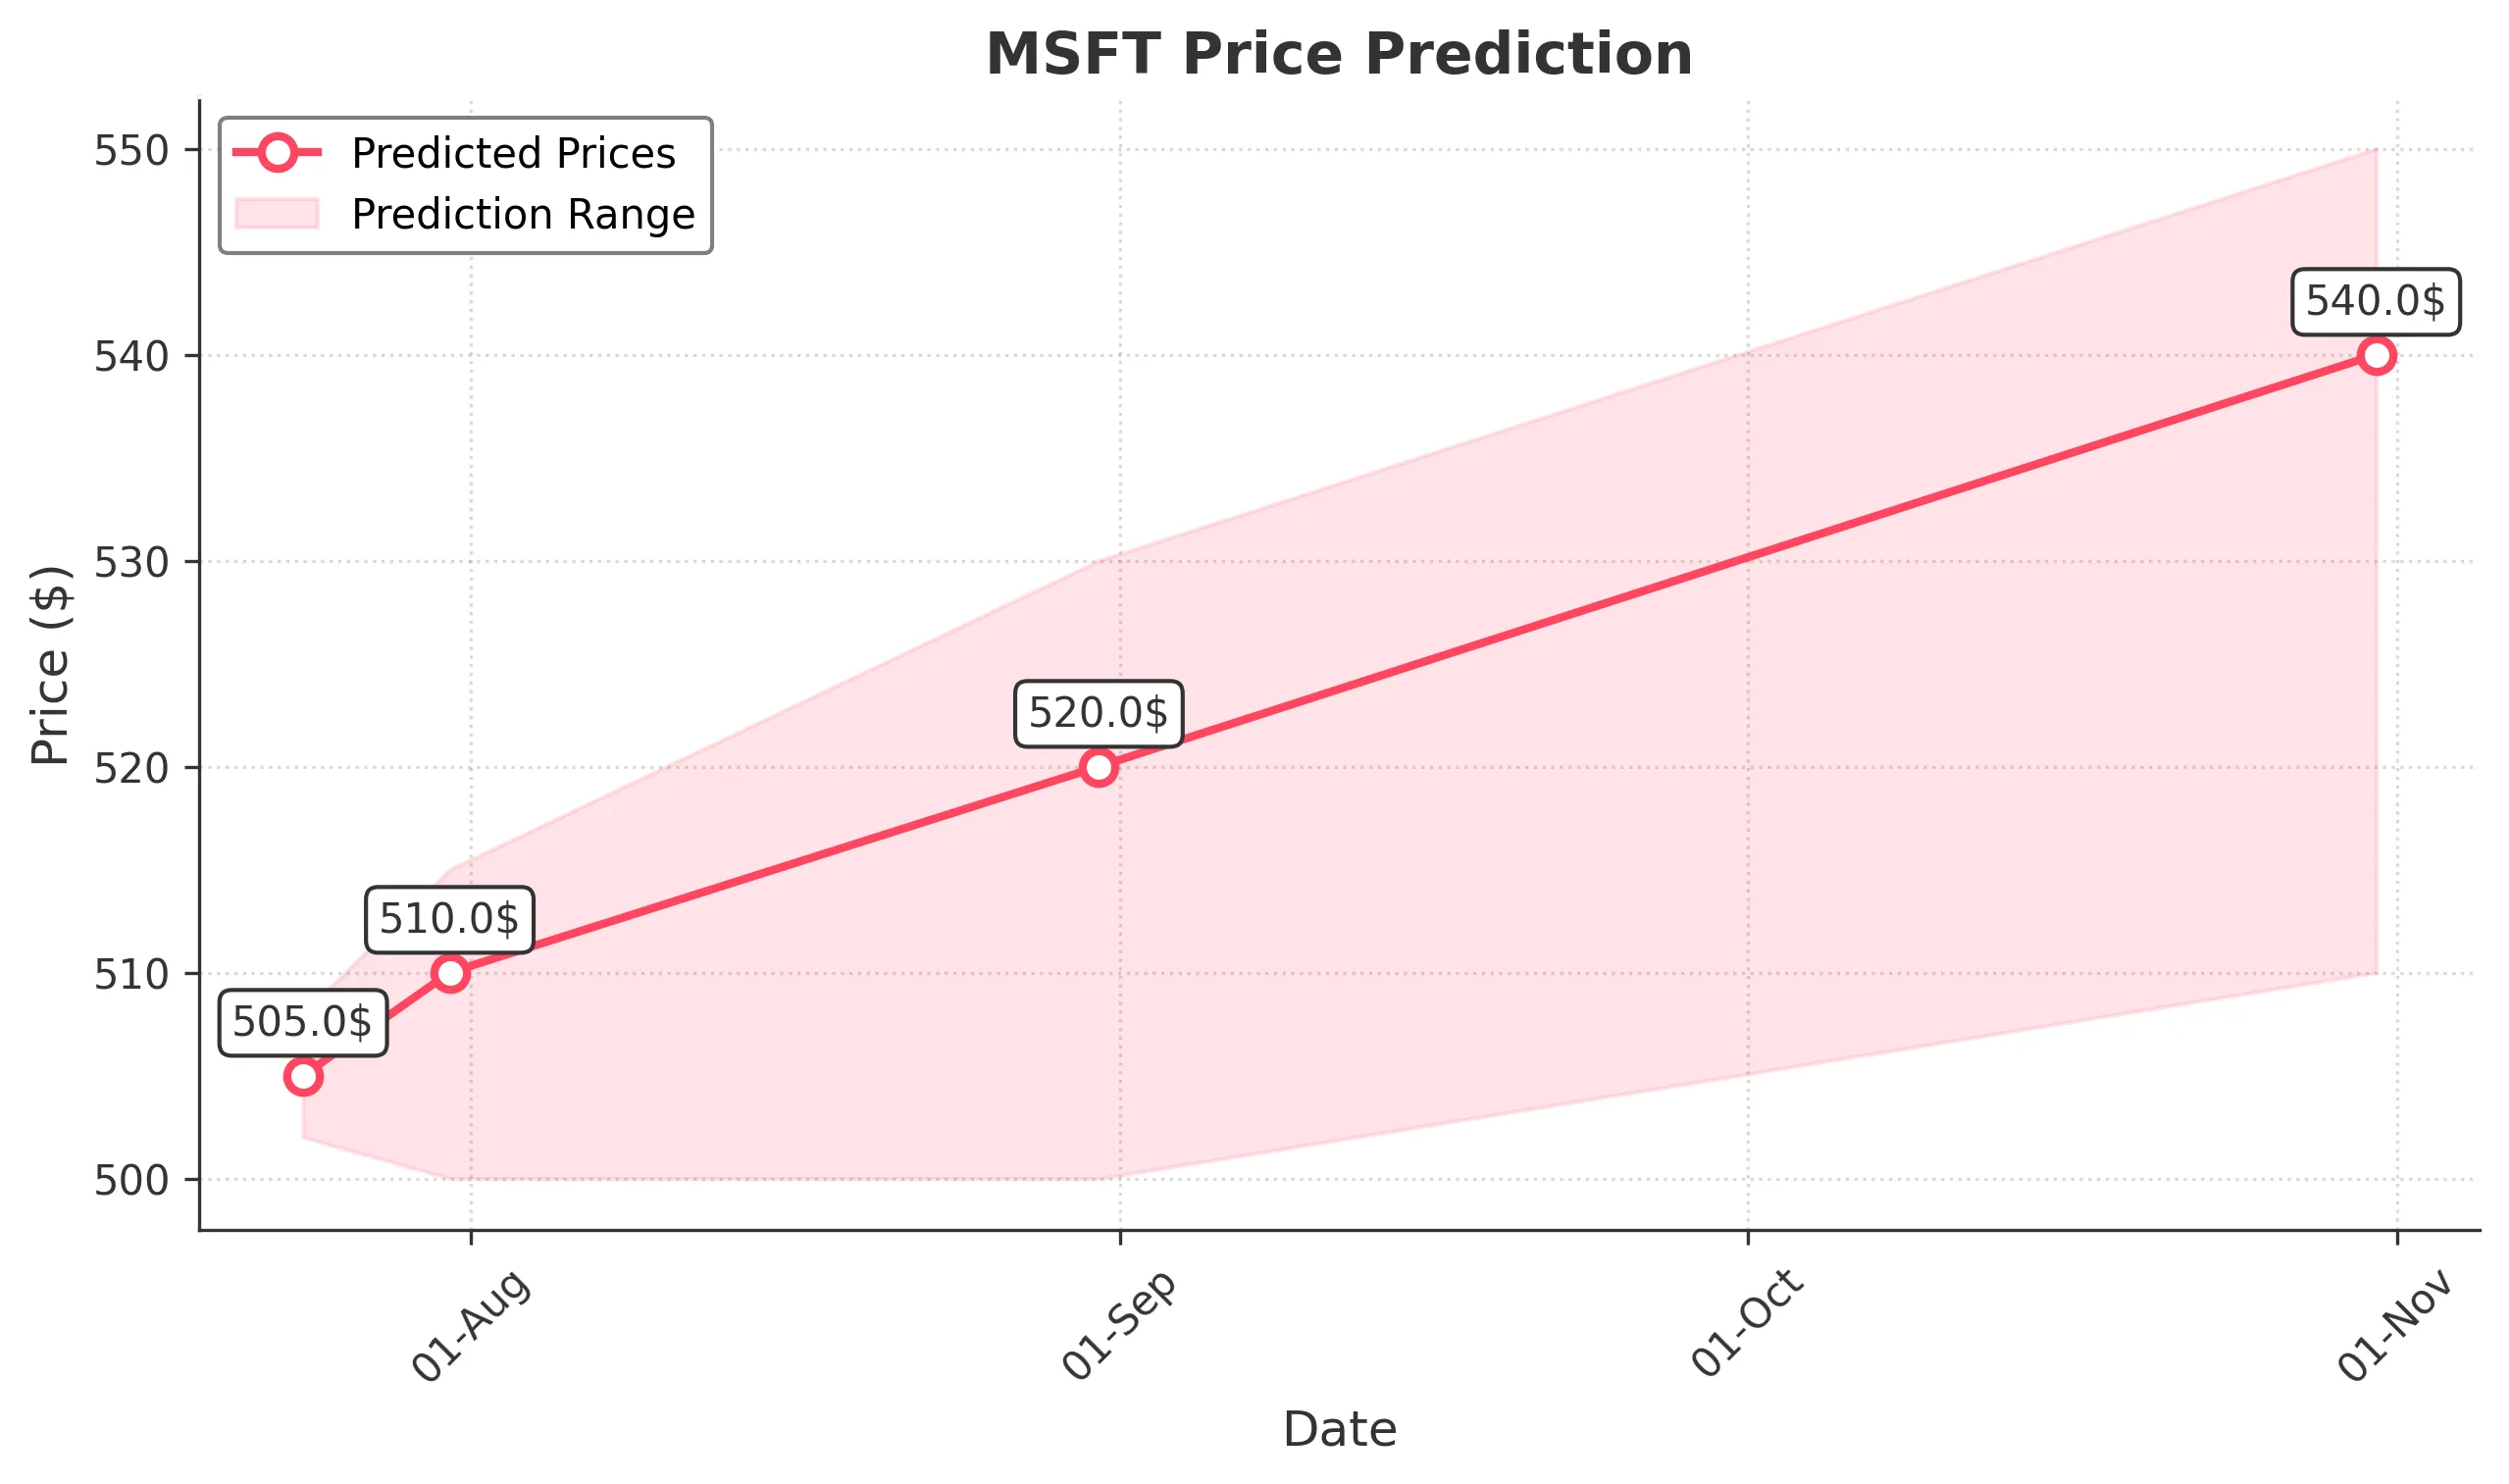
Target: July 24, 2025$505
$504
$508
$502
Description
The stock shows a slight bearish trend with recent lower closes. RSI indicates overbought conditions, suggesting a potential pullback. Volume has decreased, indicating weakening momentum. Expect a close around 505.0.
Analysis
Over the past 3 months, MSFT has shown a bullish trend with significant upward movement. Key resistance at 514.64 and support around 502.25. Recent candlestick patterns indicate potential reversal signals. Volume has been inconsistent, suggesting caution.
Confidence Level
Potential Risks
Market volatility and external news could impact the prediction. A sudden bullish sentiment could push prices higher.
1 Week Prediction
Target: July 31, 2025$510
$505
$515
$500
Description
Expect a slight recovery as the stock may bounce off support levels. However, bearish signals from the MACD and RSI suggest limited upside. Anticipate a close around 510.0.
Analysis
MSFT has been in a consolidation phase with key support at 502.25. The recent price action shows indecision, with mixed signals from technical indicators. Volume patterns indicate a lack of strong conviction in either direction.
Confidence Level
Potential Risks
Potential for market corrections or external economic factors could lead to unexpected price movements.
1 Month Prediction
Target: August 31, 2025$520
$510
$530
$500
Description
If the bullish trend resumes, expect a gradual increase towards 520.0. However, watch for resistance at 530.0. Market sentiment may shift based on earnings reports and macroeconomic data.
Analysis
The stock has shown resilience with a bullish trend over the past months. Key resistance at 530.0 and support at 500.0. Technical indicators suggest potential upward momentum, but caution is warranted due to market volatility.
Confidence Level
Potential Risks
Earnings surprises or geopolitical events could significantly alter the stock's trajectory.
3 Months Prediction
Target: October 31, 2025$540
$520
$550
$510
Description
If the current bullish trend continues, expect a close around 540.0. However, macroeconomic factors and earnings results could lead to volatility. Watch for resistance at 550.0.
Analysis
MSFT has maintained a strong upward trajectory, but recent price action shows signs of potential exhaustion. Key support at 510.0 and resistance at 550.0. Technical indicators suggest a cautious approach as market sentiment may shift.
Confidence Level
Potential Risks
Long-term predictions are subject to greater uncertainty due to potential market corrections and economic shifts.