MSFT Trading Predictions
1 Day Prediction
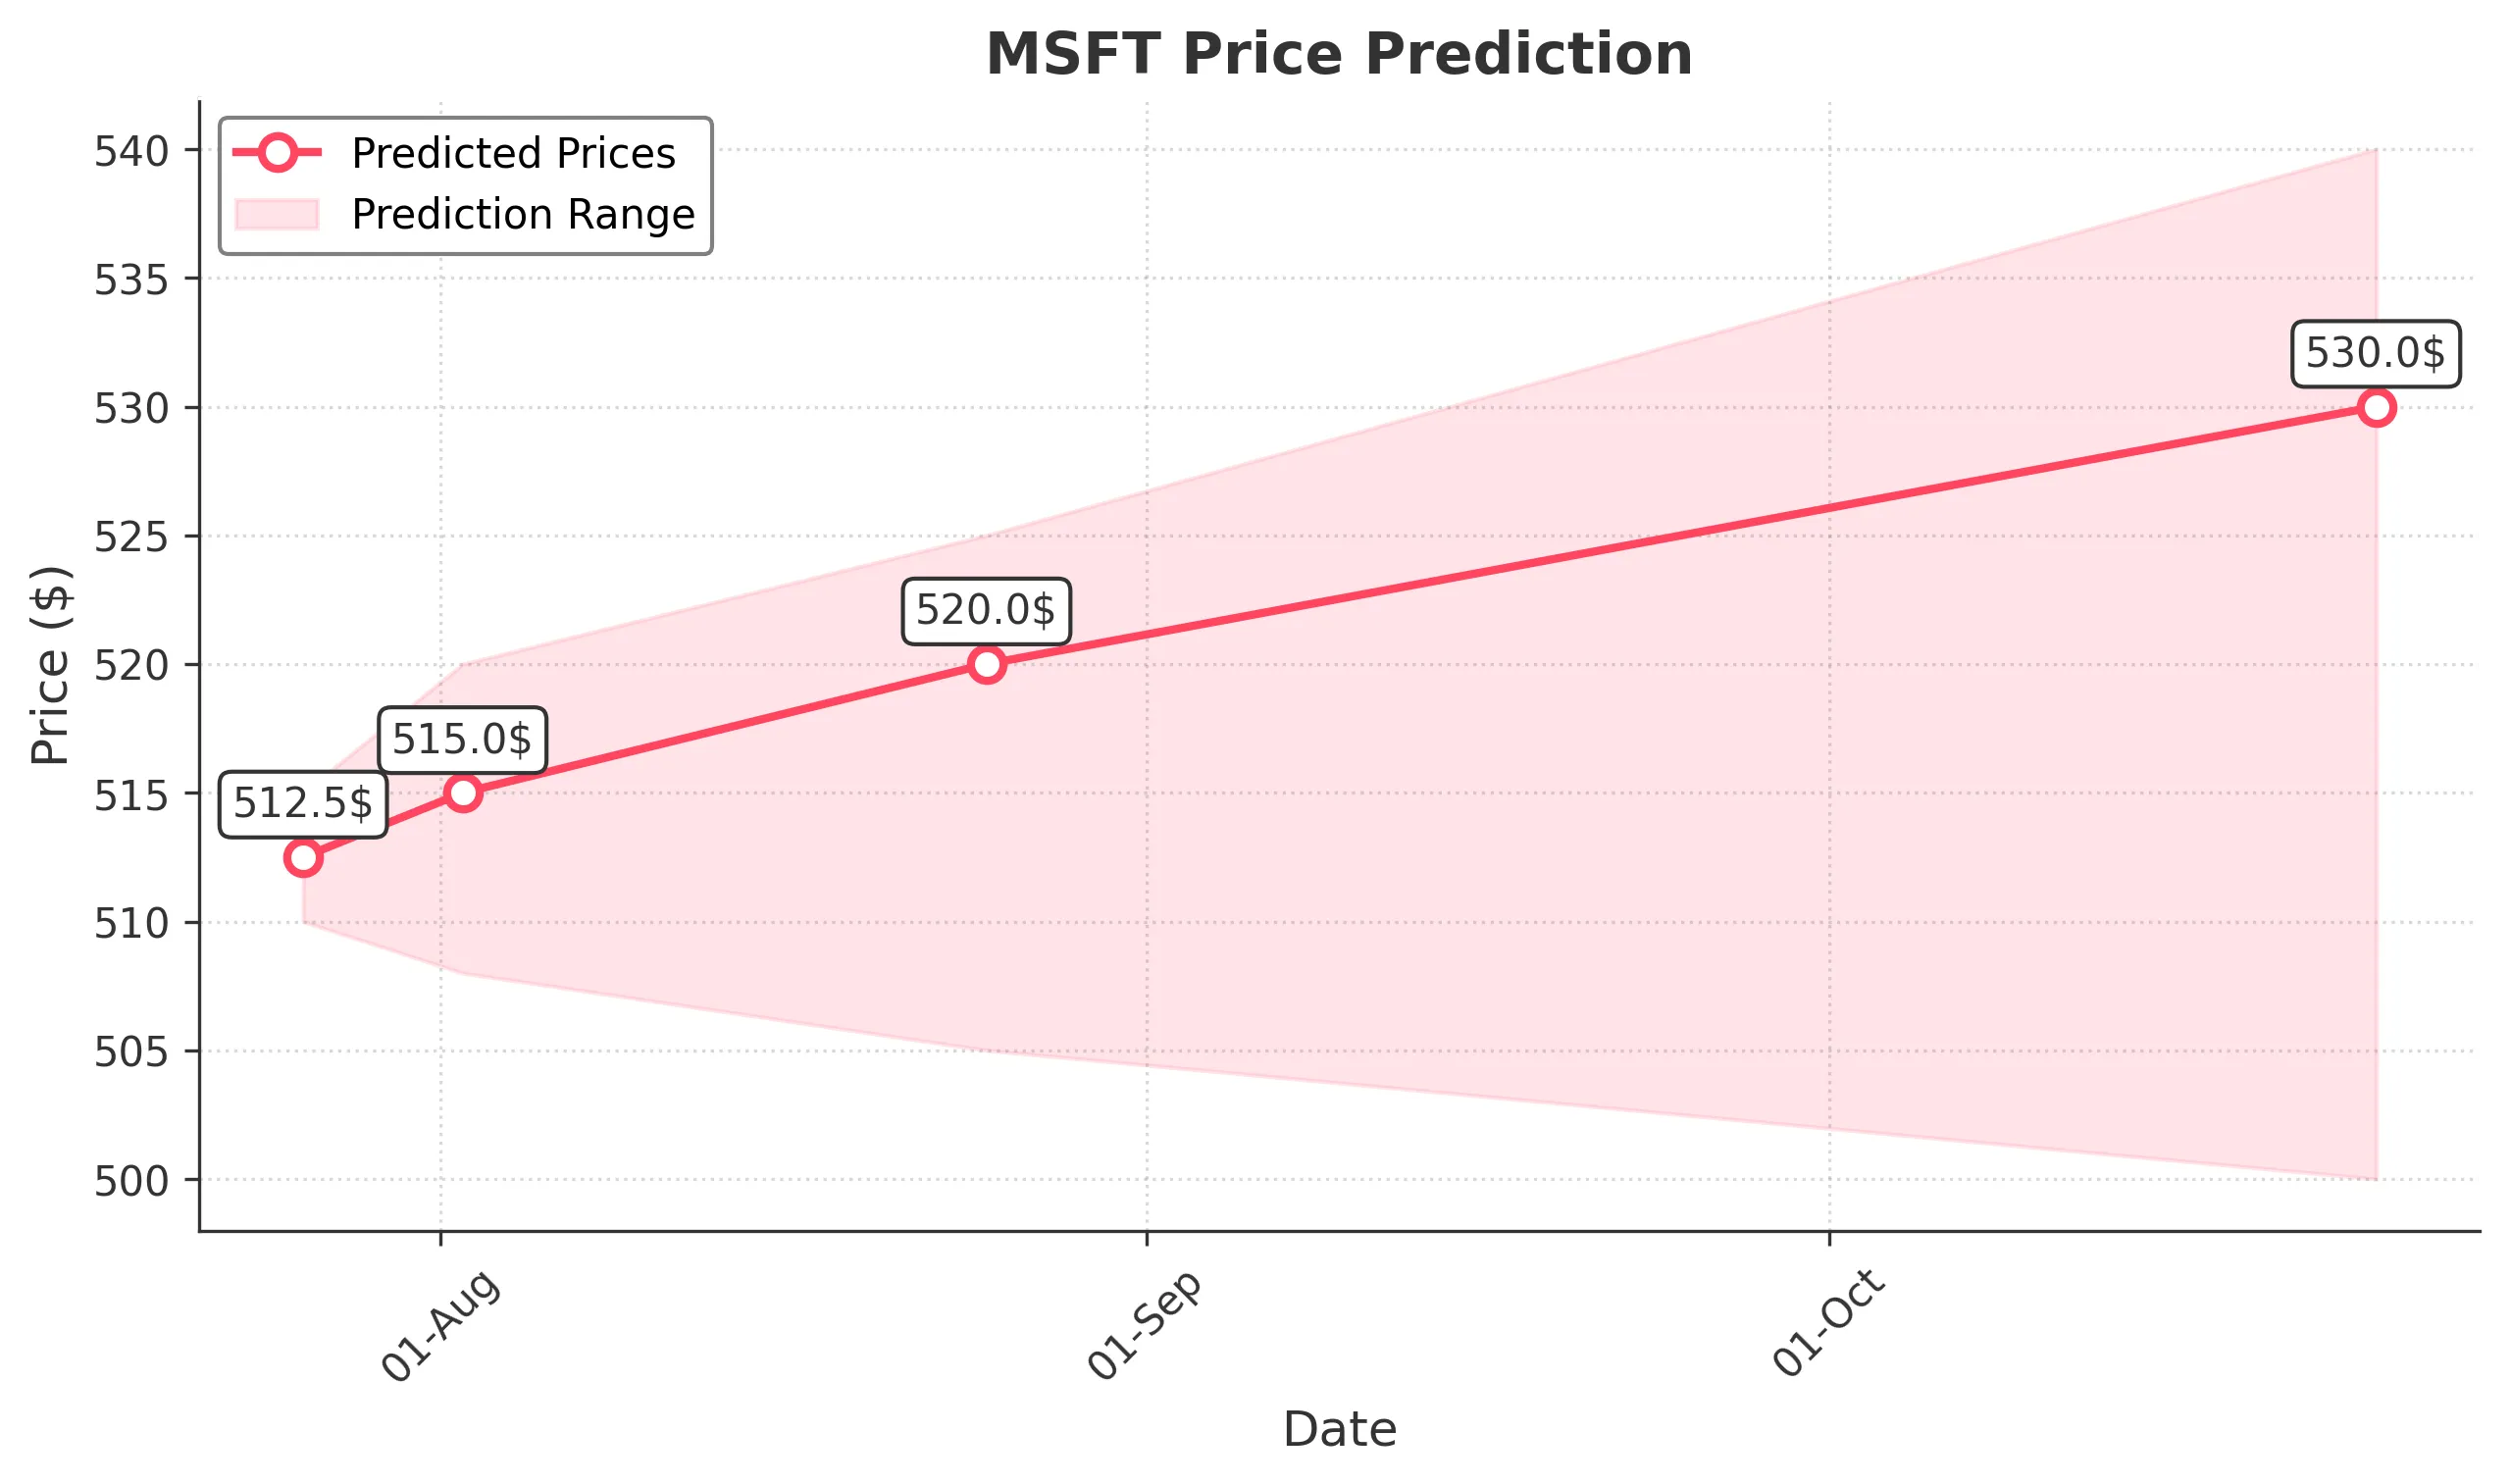
Target: July 26, 2025$512.5
$511.5
$515
$510
Description
The stock shows a bullish trend with a recent upward movement. The RSI is approaching overbought levels, indicating potential for a pullback. However, strong support at 510.00 suggests limited downside risk. Volume remains steady, supporting the upward momentum.
Analysis
Over the past 3 months, MSFT has shown a strong bullish trend, with significant upward movements and higher highs. Key support is at 510.00, while resistance is around 515.00. The MACD indicates bullish momentum, but the RSI suggests caution as it nears overbought territory.
Confidence Level
Potential Risks
Potential market volatility and profit-taking could lead to unexpected price movements.
1 Week Prediction
Target: August 2, 2025$515
$512
$520
$508
Description
The bullish trend is expected to continue, with the stock likely to test resistance at 520.00. The MACD remains positive, and the recent candlestick patterns indicate strong buying interest. However, the RSI suggests a potential pullback could occur.
Analysis
MSFT has maintained a strong upward trajectory, with significant volume spikes indicating strong buying pressure. The stock is approaching key resistance levels, and while the trend is bullish, caution is warranted due to potential overbought conditions.
Confidence Level
Potential Risks
Market sentiment could shift due to macroeconomic news, impacting the stock's performance.
1 Month Prediction
Target: August 25, 2025$520
$515
$525
$505
Description
The stock is expected to consolidate around the 520.00 level, with potential for further gains if market conditions remain favorable. The Bollinger Bands indicate a tightening range, suggesting a breakout could occur. Watch for volume trends.
Analysis
MSFT has shown resilience with a strong bullish trend, but the stock may face resistance at 520.00. The ATR indicates increasing volatility, and the RSI is nearing overbought levels, suggesting a potential correction could occur.
Confidence Level
Potential Risks
Economic indicators and earnings reports could introduce volatility, affecting the stock's trajectory.
3 Months Prediction
Target: October 25, 2025$530
$525
$540
$500
Description
Long-term bullish sentiment remains, with potential for the stock to reach 530.00. However, macroeconomic factors and earnings reports could introduce volatility. The Fibonacci retracement levels suggest support at 500.00.
Analysis
Over the past 3 months, MSFT has demonstrated strong upward momentum, but the market's overall sentiment and external economic factors could lead to fluctuations. Key support is at 500.00, while resistance is at 540.00, indicating a potential range for the stock.
Confidence Level
Potential Risks
Unforeseen market events or economic downturns could significantly impact the stock's performance.