MSFT Trading Predictions
1 Day Prediction
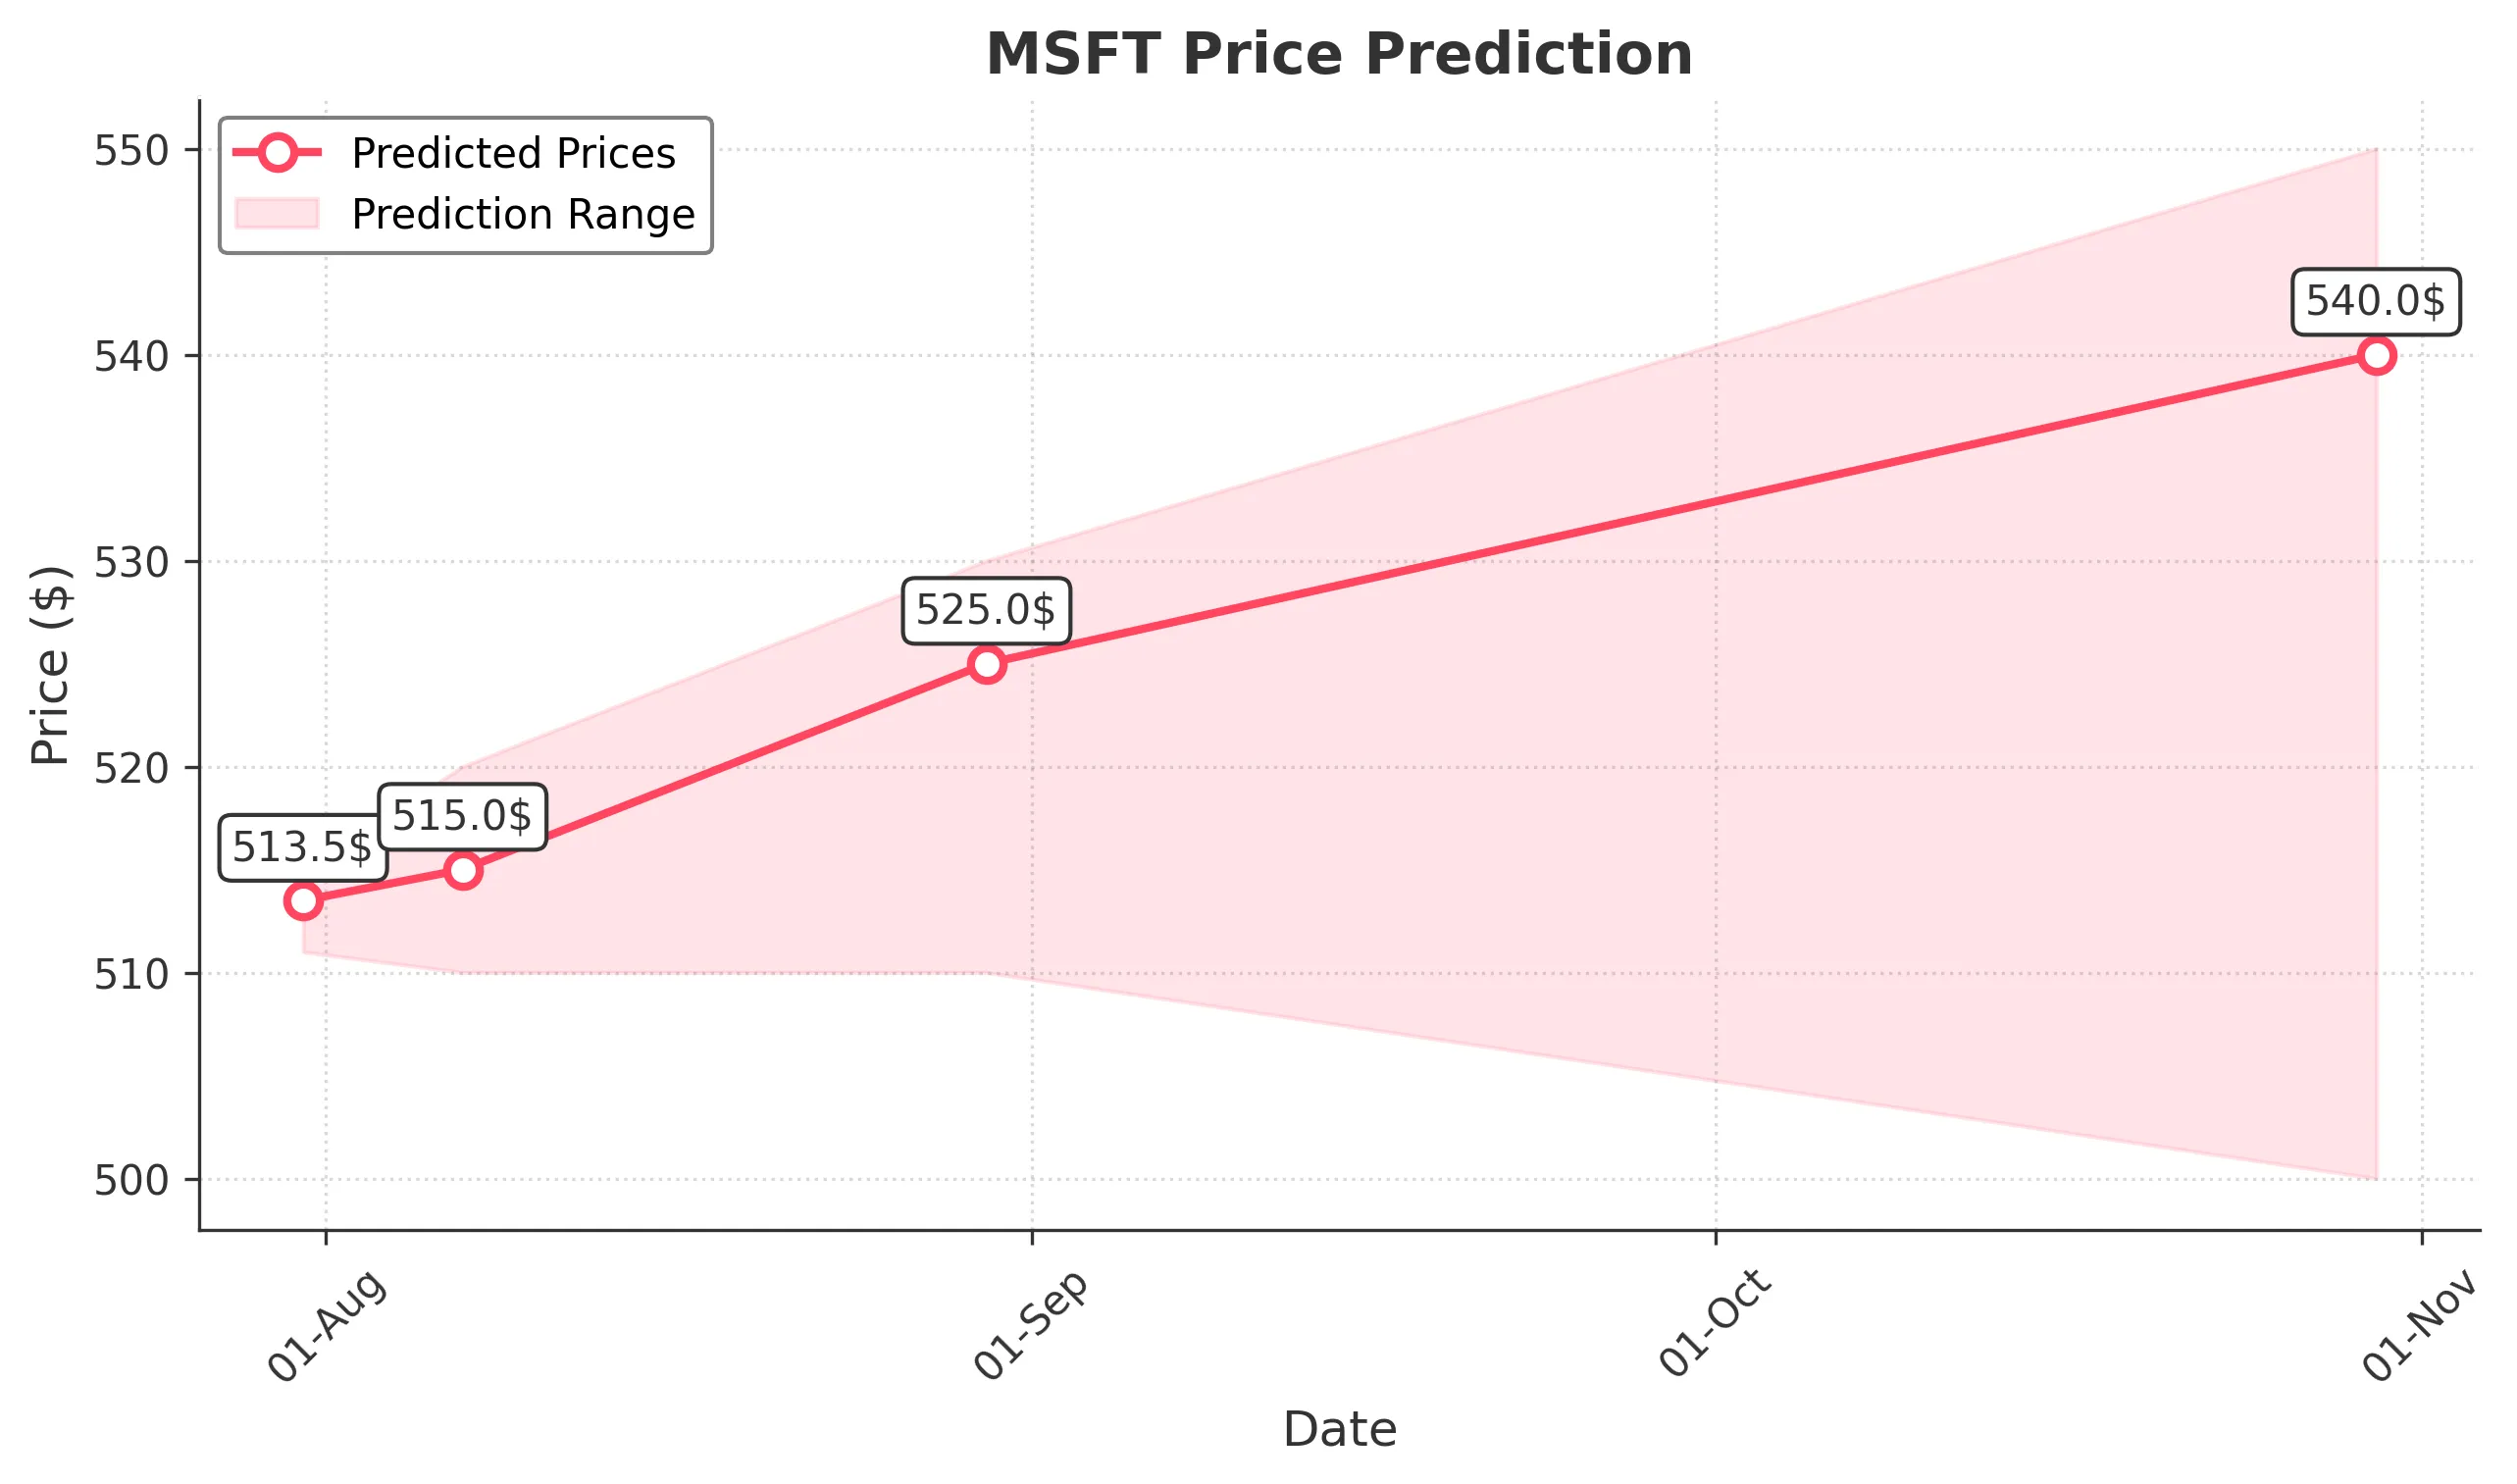
Target: July 31, 2025$513.5
$512.5
$515
$511
Description
The stock shows a slight bullish trend with a recent Doji pattern indicating indecision. The RSI is near 60, suggesting potential for upward movement, but MACD is flattening, indicating possible consolidation. Volume is expected to be moderate.
Analysis
Over the past 3 months, MSFT has shown a bullish trend with significant upward momentum, reaching new highs. Key support is around 510, while resistance is near 515. The MACD indicates a potential slowdown in momentum, and recent volume spikes suggest increased interest.
Confidence Level
Potential Risks
Market sentiment could shift due to macroeconomic news or earnings reports, which may impact trading volume and price direction.
1 Week Prediction
Target: August 7, 2025$515
$513.5
$520
$510
Description
The stock is expected to maintain its bullish trend, supported by a recent breakout above resistance levels. The RSI remains healthy, and the MACD is positive. However, a potential pullback could occur if volume decreases significantly.
Analysis
MSFT has been on a strong upward trajectory, with key resistance at 520. The recent price action shows bullish candlestick patterns, and the average volume indicates strong buying interest. However, caution is warranted as the market may react to external news.
Confidence Level
Potential Risks
External factors such as economic data releases or geopolitical events could introduce volatility, impacting the stock's performance.
1 Month Prediction
Target: August 30, 2025$525
$515
$530
$510
Description
The stock is projected to continue its upward trend, supported by strong fundamentals and positive market sentiment. The Bollinger Bands indicate potential for further price expansion, but overbought conditions may lead to corrections.
Analysis
MSFT has shown consistent growth, with strong support at 510 and resistance at 530. The RSI is approaching overbought territory, suggesting caution. Volume trends indicate sustained interest, but potential volatility remains a concern.
Confidence Level
Potential Risks
Market corrections or profit-taking could lead to short-term declines, and any negative news could impact investor sentiment.
3 Months Prediction
Target: October 30, 2025$540
$525
$550
$500
Description
Long-term bullish sentiment is expected to prevail, driven by strong earnings and market demand. However, the stock may face resistance at 550, and profit-taking could lead to volatility.
Analysis
MSFT's performance over the last three months has been robust, with a clear upward trend. Key support is at 500, while resistance is at 550. The stock's fundamentals remain strong, but external economic factors could introduce uncertainty.
Confidence Level
Potential Risks
Economic downturns or changes in market sentiment could lead to significant price corrections, impacting the overall forecast.