MSFT Trading Predictions
1 Day Prediction
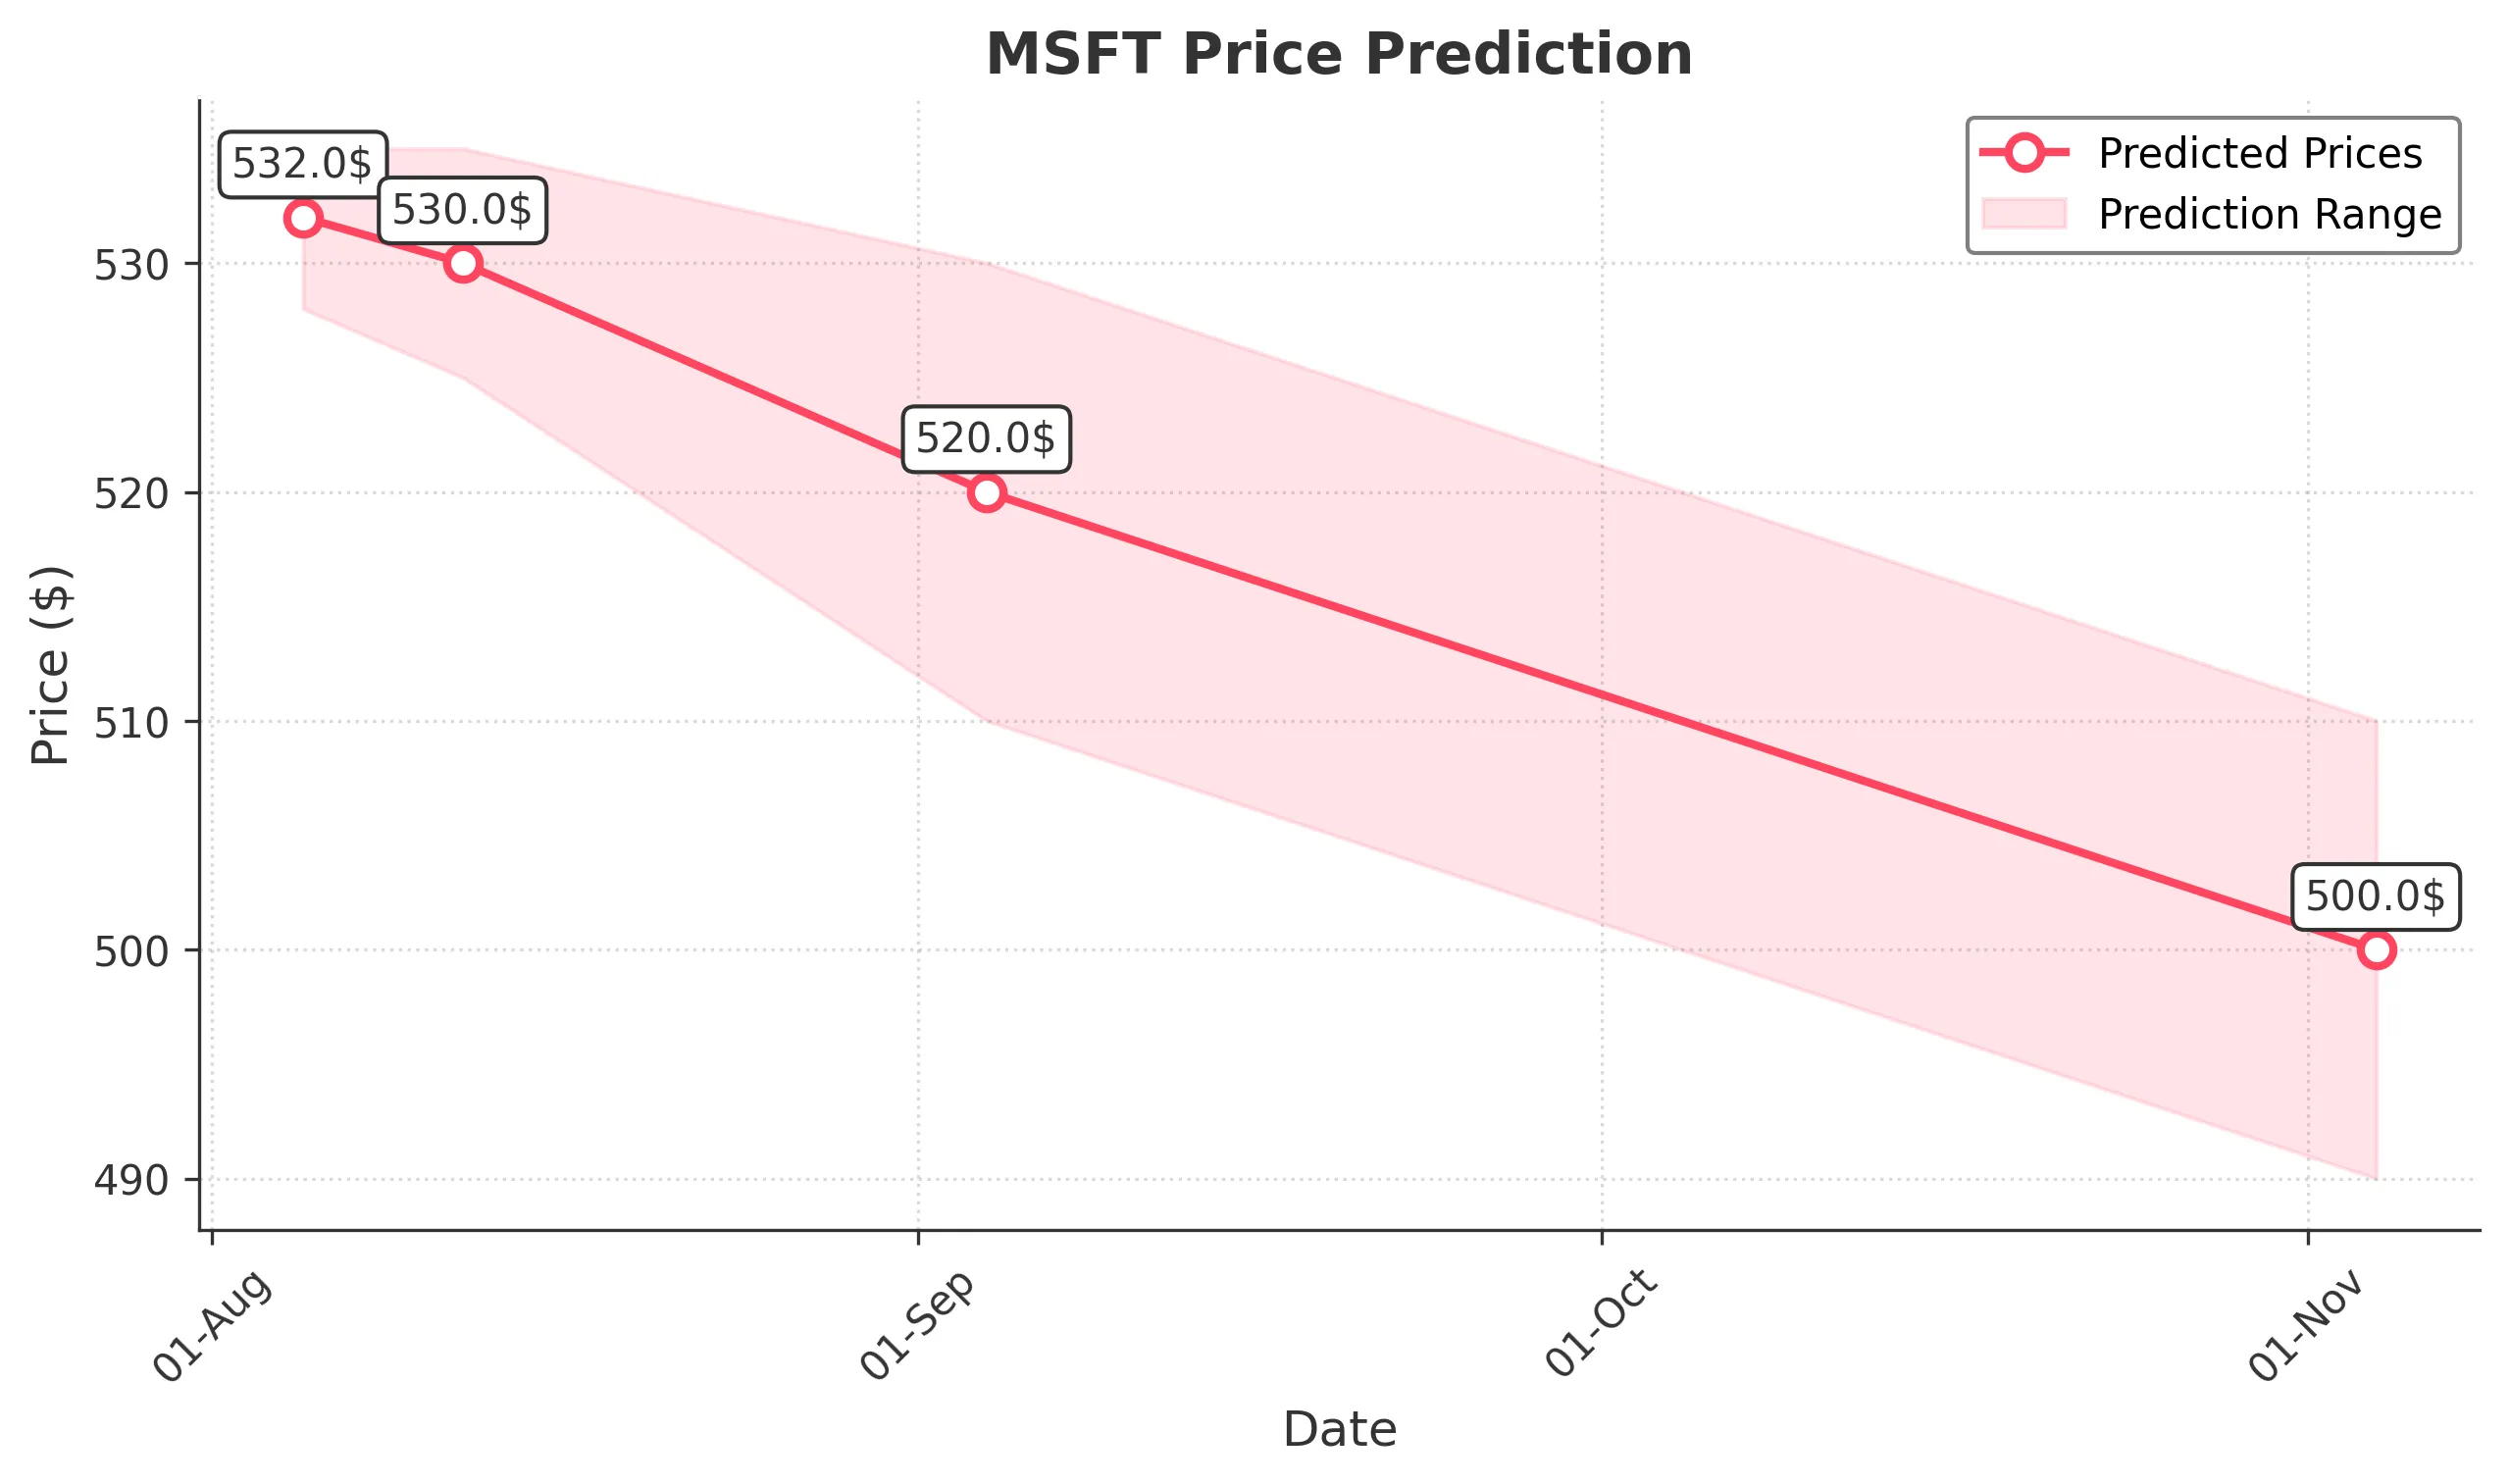
Target: August 5, 2025$532
$530
$535
$528
Description
The stock shows a bullish trend with a recent breakout above resistance at 530. The RSI indicates overbought conditions, suggesting a potential pullback. However, strong volume supports the upward momentum.
Analysis
Over the past 3 months, MSFT has shown a strong bullish trend, recently breaking above key resistance levels. The MACD is bullish, and the ATR indicates increasing volatility. Volume spikes on up days suggest strong buying interest.
Confidence Level
Potential Risks
Potential profit-taking could lead to a short-term decline, especially if market sentiment shifts.
1 Week Prediction
Target: August 12, 2025$530
$532
$535
$525
Description
The stock may consolidate around current levels after a strong rally. The Bollinger Bands indicate potential sideways movement, while the RSI suggests overbought conditions.
Analysis
MSFT has been in a strong uptrend, but recent candlestick patterns indicate potential exhaustion. Support is seen at 525, while resistance remains at 535. Volume analysis shows healthy buying, but caution is warranted.
Confidence Level
Potential Risks
Market corrections or negative news could impact the stock's performance, leading to a potential decline.
1 Month Prediction
Target: September 4, 2025$520
$525
$530
$510
Description
A potential pullback is expected as the stock approaches overbought territory. Fibonacci retracement levels suggest support at 510, while resistance at 530 may hold.
Analysis
The stock has shown strong performance, but the recent rally may lead to profit-taking. Key support at 510 and resistance at 530 are critical levels to watch. The MACD is showing signs of divergence, indicating potential weakness.
Confidence Level
Potential Risks
Economic data releases or earnings reports could significantly impact stock performance, leading to volatility.
3 Months Prediction
Target: November 4, 2025$500
$505
$510
$490
Description
Longer-term outlook suggests a bearish trend as the stock may face resistance at 510. Market sentiment could shift due to macroeconomic factors, leading to a decline.
Analysis
Over the past 3 months, MSFT has experienced strong bullish momentum, but signs of a potential reversal are emerging. Key support at 490 and resistance at 510 are critical. The overall market sentiment and economic conditions will play a significant role in future performance.
Confidence Level
Potential Risks
Unforeseen macroeconomic events or earnings surprises could lead to significant volatility and impact the prediction.