MSFT Trading Predictions
1 Day Prediction
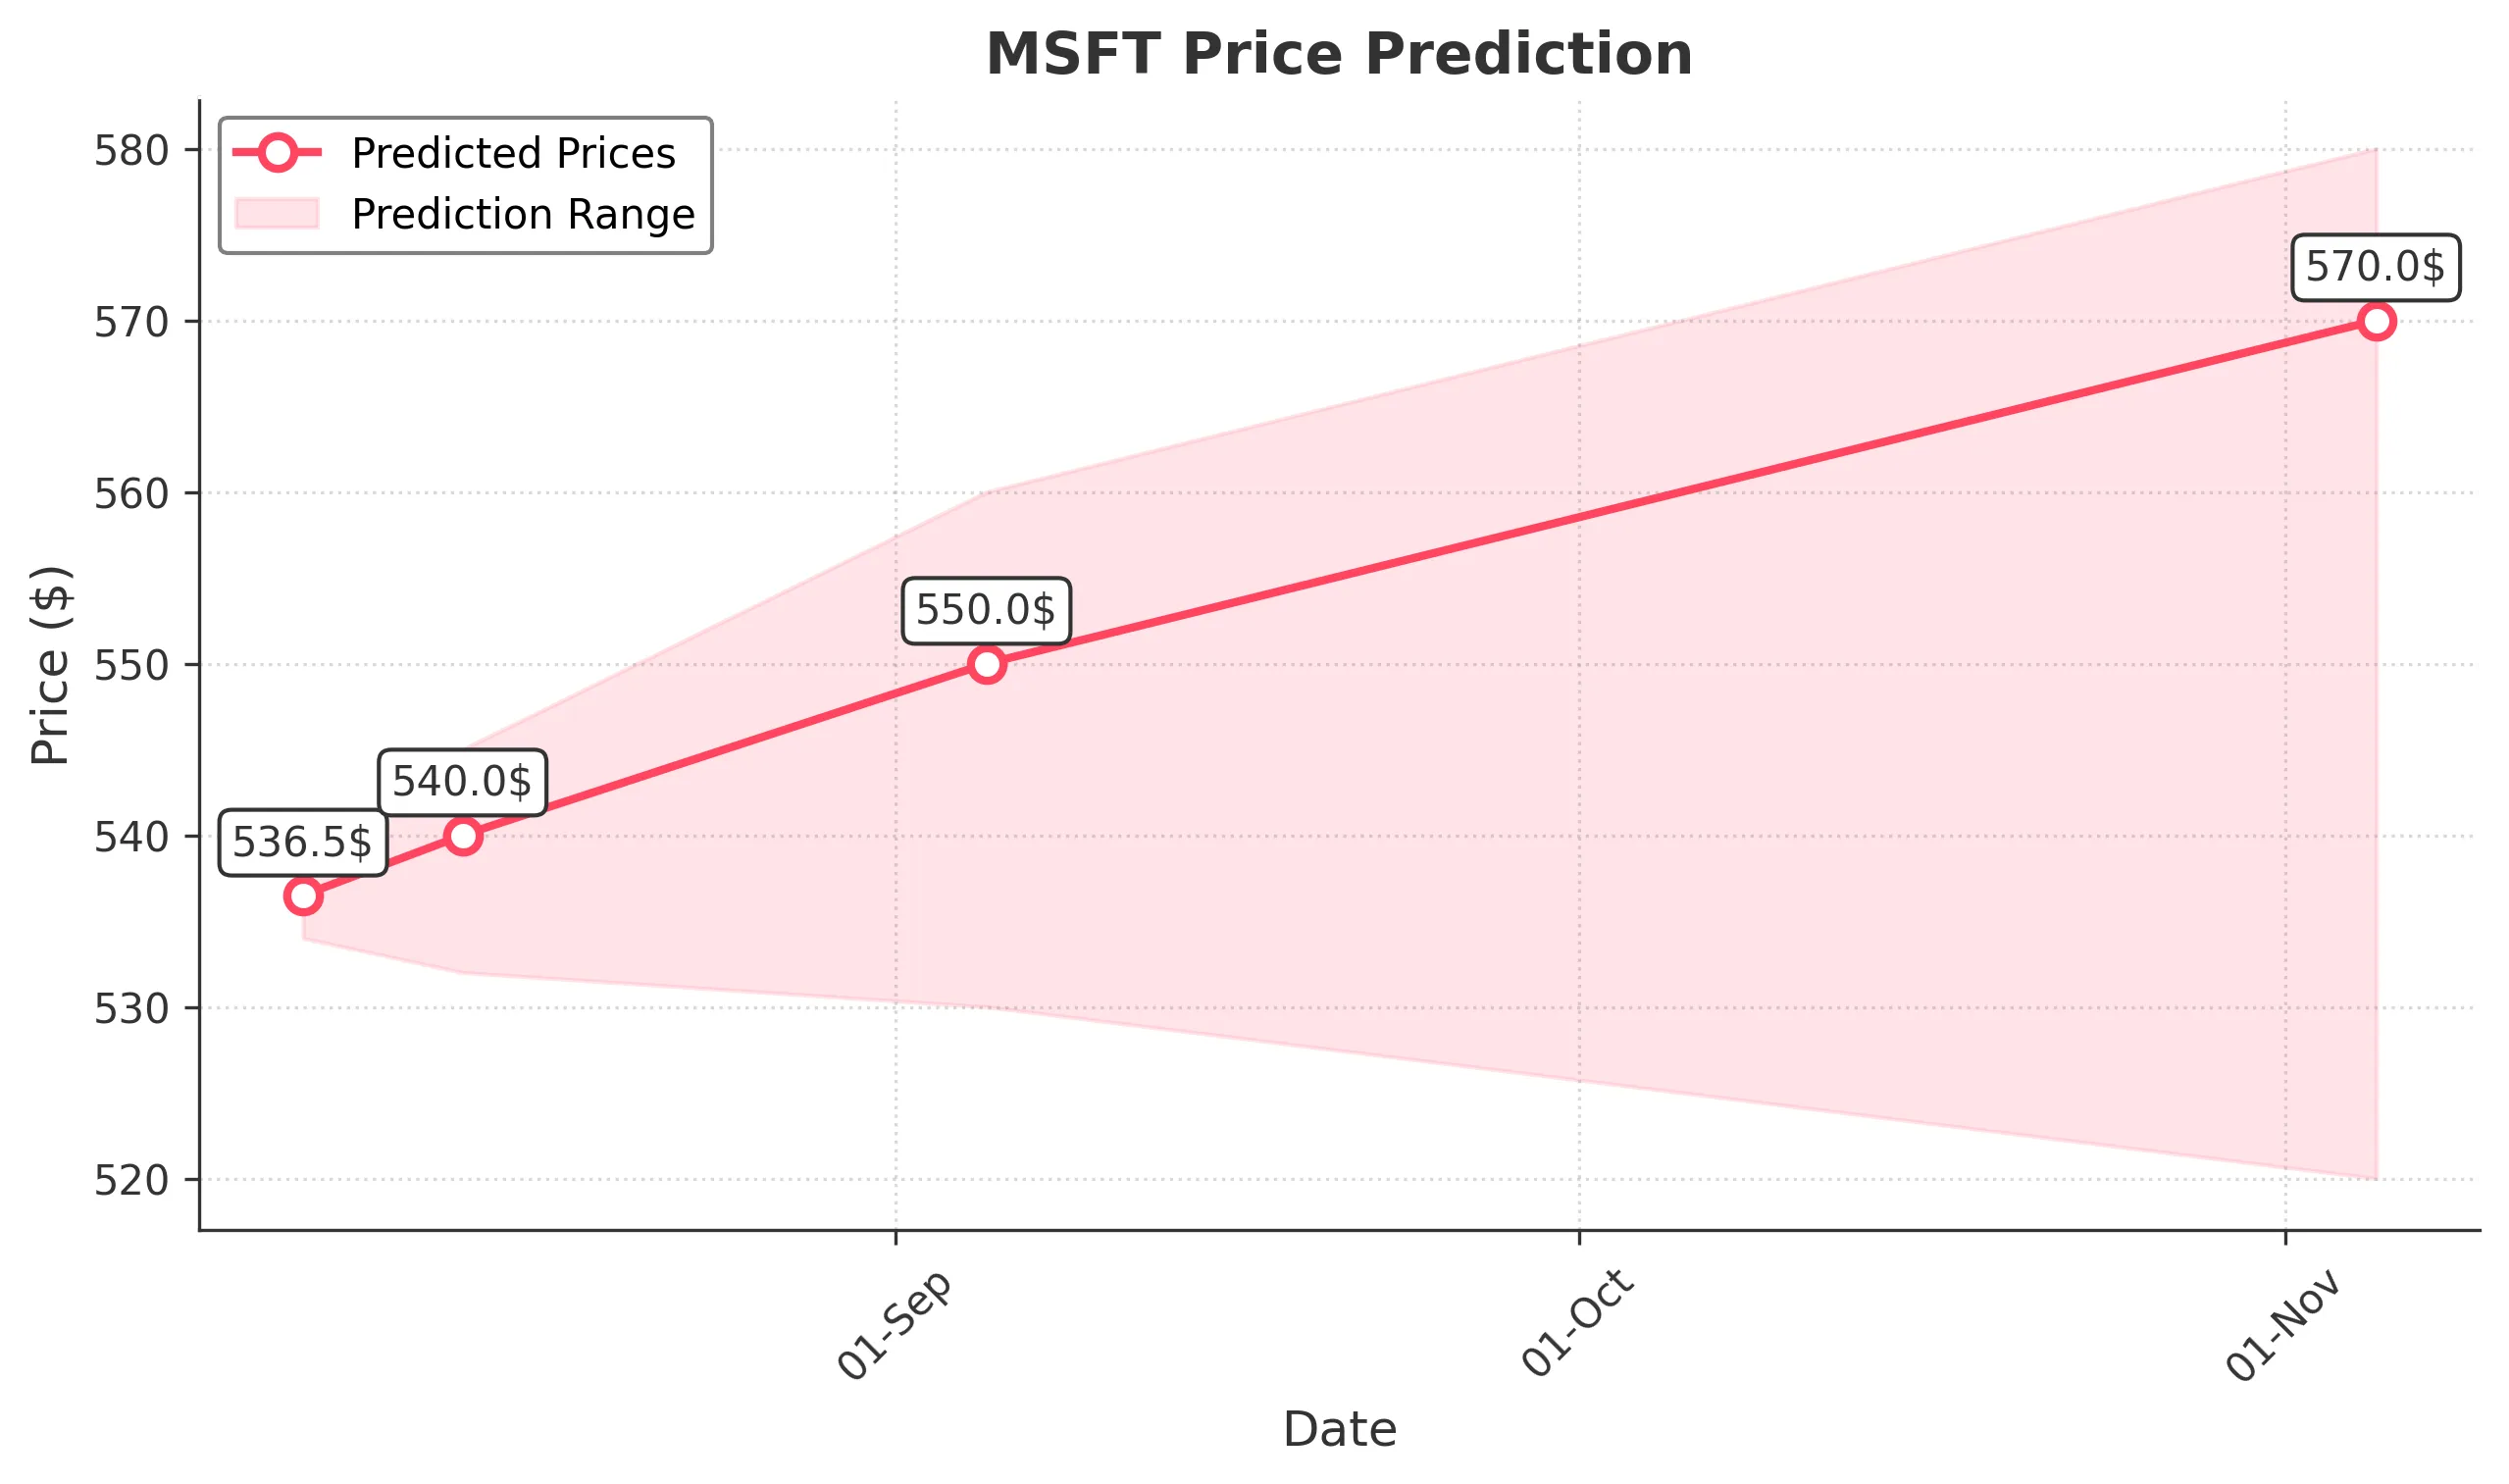
Target: August 6, 2025$536.5
$535.5
$538.5
$534
Description
The stock shows a bullish trend with a recent breakout above resistance at 535. The RSI is near 70, indicating overbought conditions, but momentum remains strong. Expect slight profit-taking, leading to a minor pullback.
Analysis
MSFT has been in a bullish trend, recently breaking above key resistance levels. The RSI indicates overbought conditions, and volume has been strong, suggesting continued interest. However, the market's volatility and external factors could lead to short-term corrections.
Confidence Level
Potential Risks
Potential for a reversal if profit-taking intensifies or if macroeconomic news impacts market sentiment.
1 Week Prediction
Target: August 13, 2025$540
$536
$545
$532
Description
The bullish momentum is expected to continue, with the stock likely testing the 545 resistance level. The MACD shows a bullish crossover, and the volume remains supportive. Watch for potential pullbacks as traders take profits.
Analysis
Over the past three months, MSFT has shown strong upward momentum, with significant support at 520. The recent price action indicates bullish sentiment, but the RSI suggests caution as it approaches overbought territory. Volume patterns indicate strong buying interest.
Confidence Level
Potential Risks
Market sentiment could shift due to economic data releases or geopolitical events, which may affect the stock's upward trajectory.
1 Month Prediction
Target: September 5, 2025$550
$540
$560
$530
Description
Expect continued bullish momentum as MSFT approaches the 550-560 resistance zone. The Fibonacci retracement levels support this target, but overbought conditions may lead to volatility. Watch for any bearish divergence in momentum indicators.
Analysis
MSFT has been on a strong upward trend, with key support at 520 and resistance at 550. The MACD and moving averages indicate bullish momentum, but the RSI suggests caution. Volume has been robust, indicating strong interest, but external factors could introduce volatility.
Confidence Level
Potential Risks
Potential for market corrections or negative news could impact the stock's ability to maintain upward momentum.
3 Months Prediction
Target: November 5, 2025$570
$550
$580
$520
Description
Long-term bullish outlook as MSFT may reach the 570-580 range, supported by strong fundamentals and market sentiment. However, potential economic downturns or earnings misses could lead to significant corrections.
Analysis
MSFT has shown resilience and strong performance over the past three months, with bullish trends and significant support levels. However, the market's overall volatility and potential economic shifts could pose risks to sustained growth. A balanced view is necessary as external factors may influence price movements.
Confidence Level
Potential Risks
Economic conditions, interest rate changes, or unexpected earnings results could significantly impact the stock's performance.