MSFT Trading Predictions
1 Day Prediction
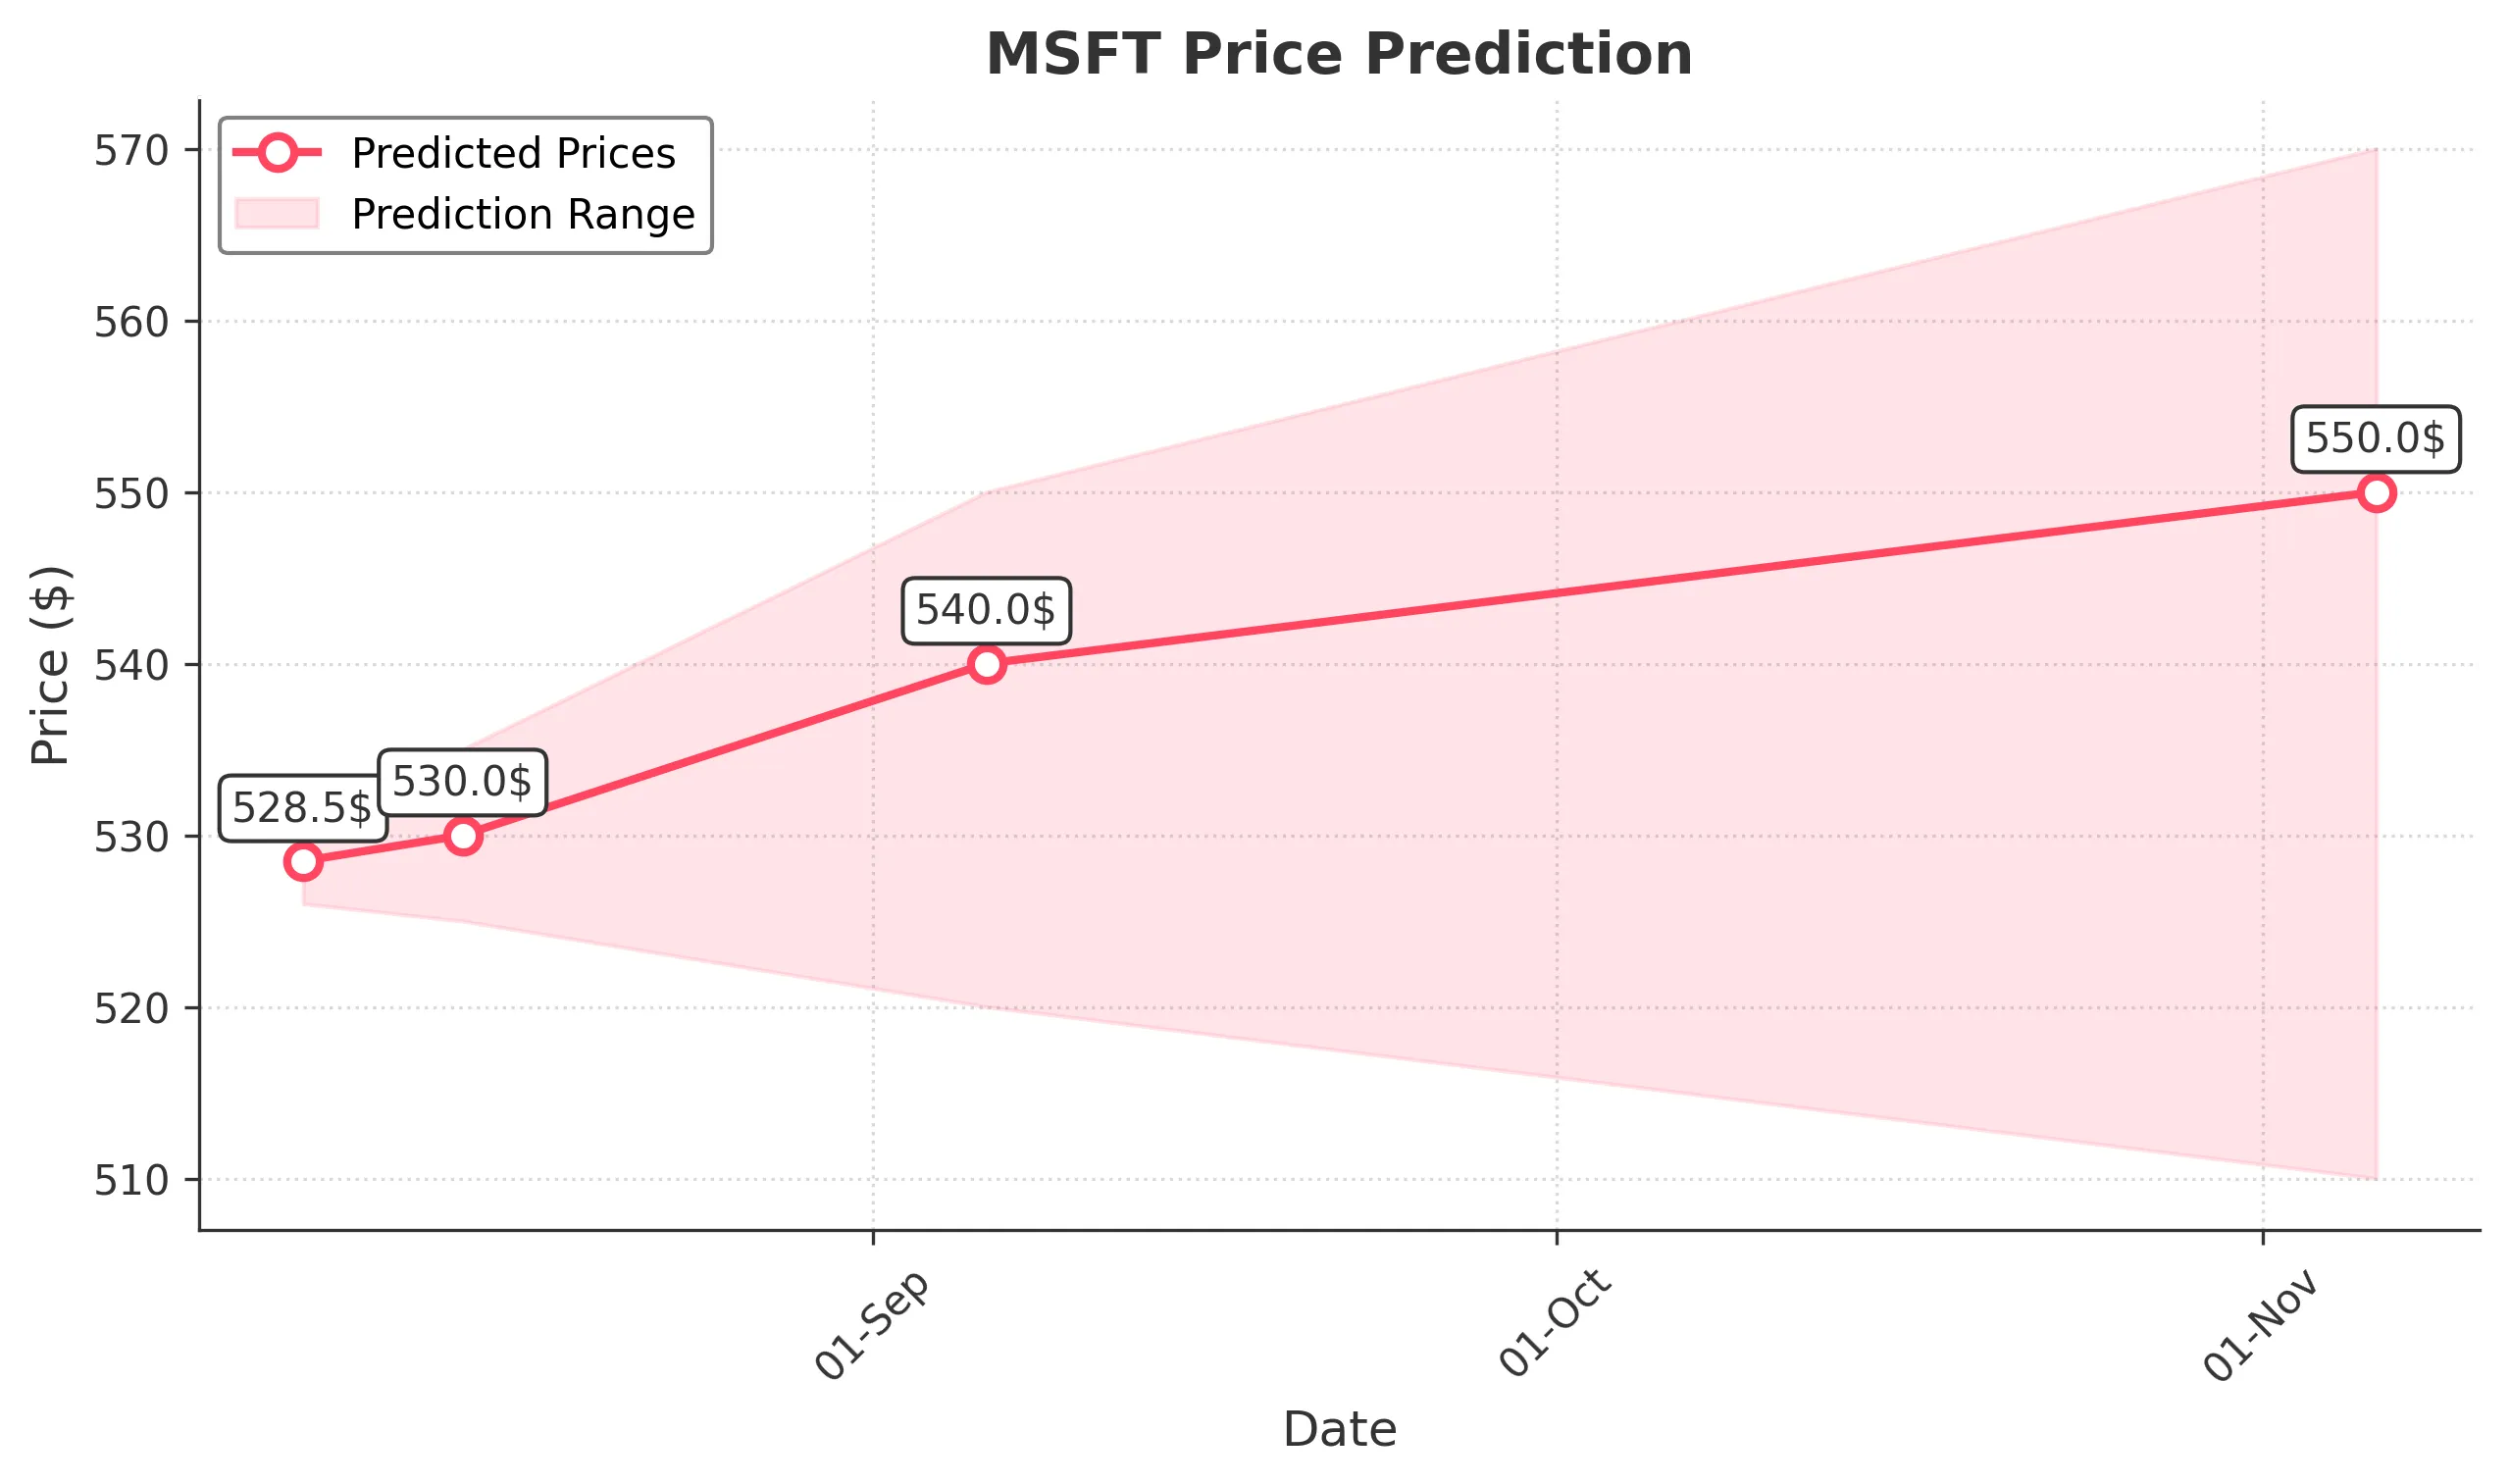
Target: August 7, 2025$528.5
$528
$530
$526
Description
The stock shows a slight bullish trend with a recent Doji candlestick indicating indecision. The RSI is near 60, suggesting potential upward momentum. However, the MACD is flattening, indicating a possible reversal. Volume is expected to increase as traders react to earnings reports.
Analysis
Over the past 3 months, MSFT has shown a bullish trend with significant upward movement, reaching a peak of 533.50. Key support is at 510, while resistance is around 550. The RSI indicates strength, but the MACD divergence suggests caution. Volume spikes on certain days indicate strong interest.
Confidence Level
Potential Risks
Market volatility and external news could impact the price. A bearish reversal is possible if the market sentiment shifts.
1 Week Prediction
Target: August 14, 2025$530
$528.5
$535
$525
Description
The stock is expected to maintain its bullish trend, supported by recent positive earnings sentiment. The Bollinger Bands are widening, indicating increased volatility. However, the RSI nearing overbought levels suggests caution. A pullback could occur if profit-taking happens.
Analysis
MSFT has been on a strong upward trajectory, with significant volume supporting the price increases. The recent high of 533.50 indicates strong buying interest. Key support is at 510, while resistance remains at 550. The market sentiment is generally positive, but caution is warranted.
Confidence Level
Potential Risks
Potential profit-taking and macroeconomic factors could lead to a price correction. Watch for any negative news that could impact sentiment.
1 Month Prediction
Target: September 6, 2025$540
$530
$550
$520
Description
The stock is projected to continue its upward trend, driven by strong fundamentals and positive market sentiment. The Fibonacci retracement levels suggest a target around 540. However, the RSI indicates potential overbought conditions, which could lead to a pullback.
Analysis
MSFT has shown consistent growth, with a bullish trend supported by strong earnings. The stock has reached significant resistance levels, and while the outlook remains positive, caution is advised due to potential overbought conditions. Key support is at 510, with resistance at 550.
Confidence Level
Potential Risks
External economic factors and earnings reports could influence the stock's performance. A sudden market downturn could reverse the trend.
3 Months Prediction
Target: November 6, 2025$550
$540
$570
$510
Description
The stock is expected to reach new highs as market conditions remain favorable. The MACD indicates bullish momentum, and the RSI is expected to stabilize. However, potential market corrections could occur if economic indicators turn negative.
Analysis
MSFT has maintained a strong bullish trend over the past three months, with significant price increases. The stock is approaching key resistance levels, and while the outlook is positive, market volatility and external factors could lead to corrections. Key support remains at 510.
Confidence Level
Potential Risks
Unforeseen macroeconomic events or changes in market sentiment could impact the stock's trajectory. Watch for earnings reports and economic data releases.