MSFT Trading Predictions
1 Day Prediction
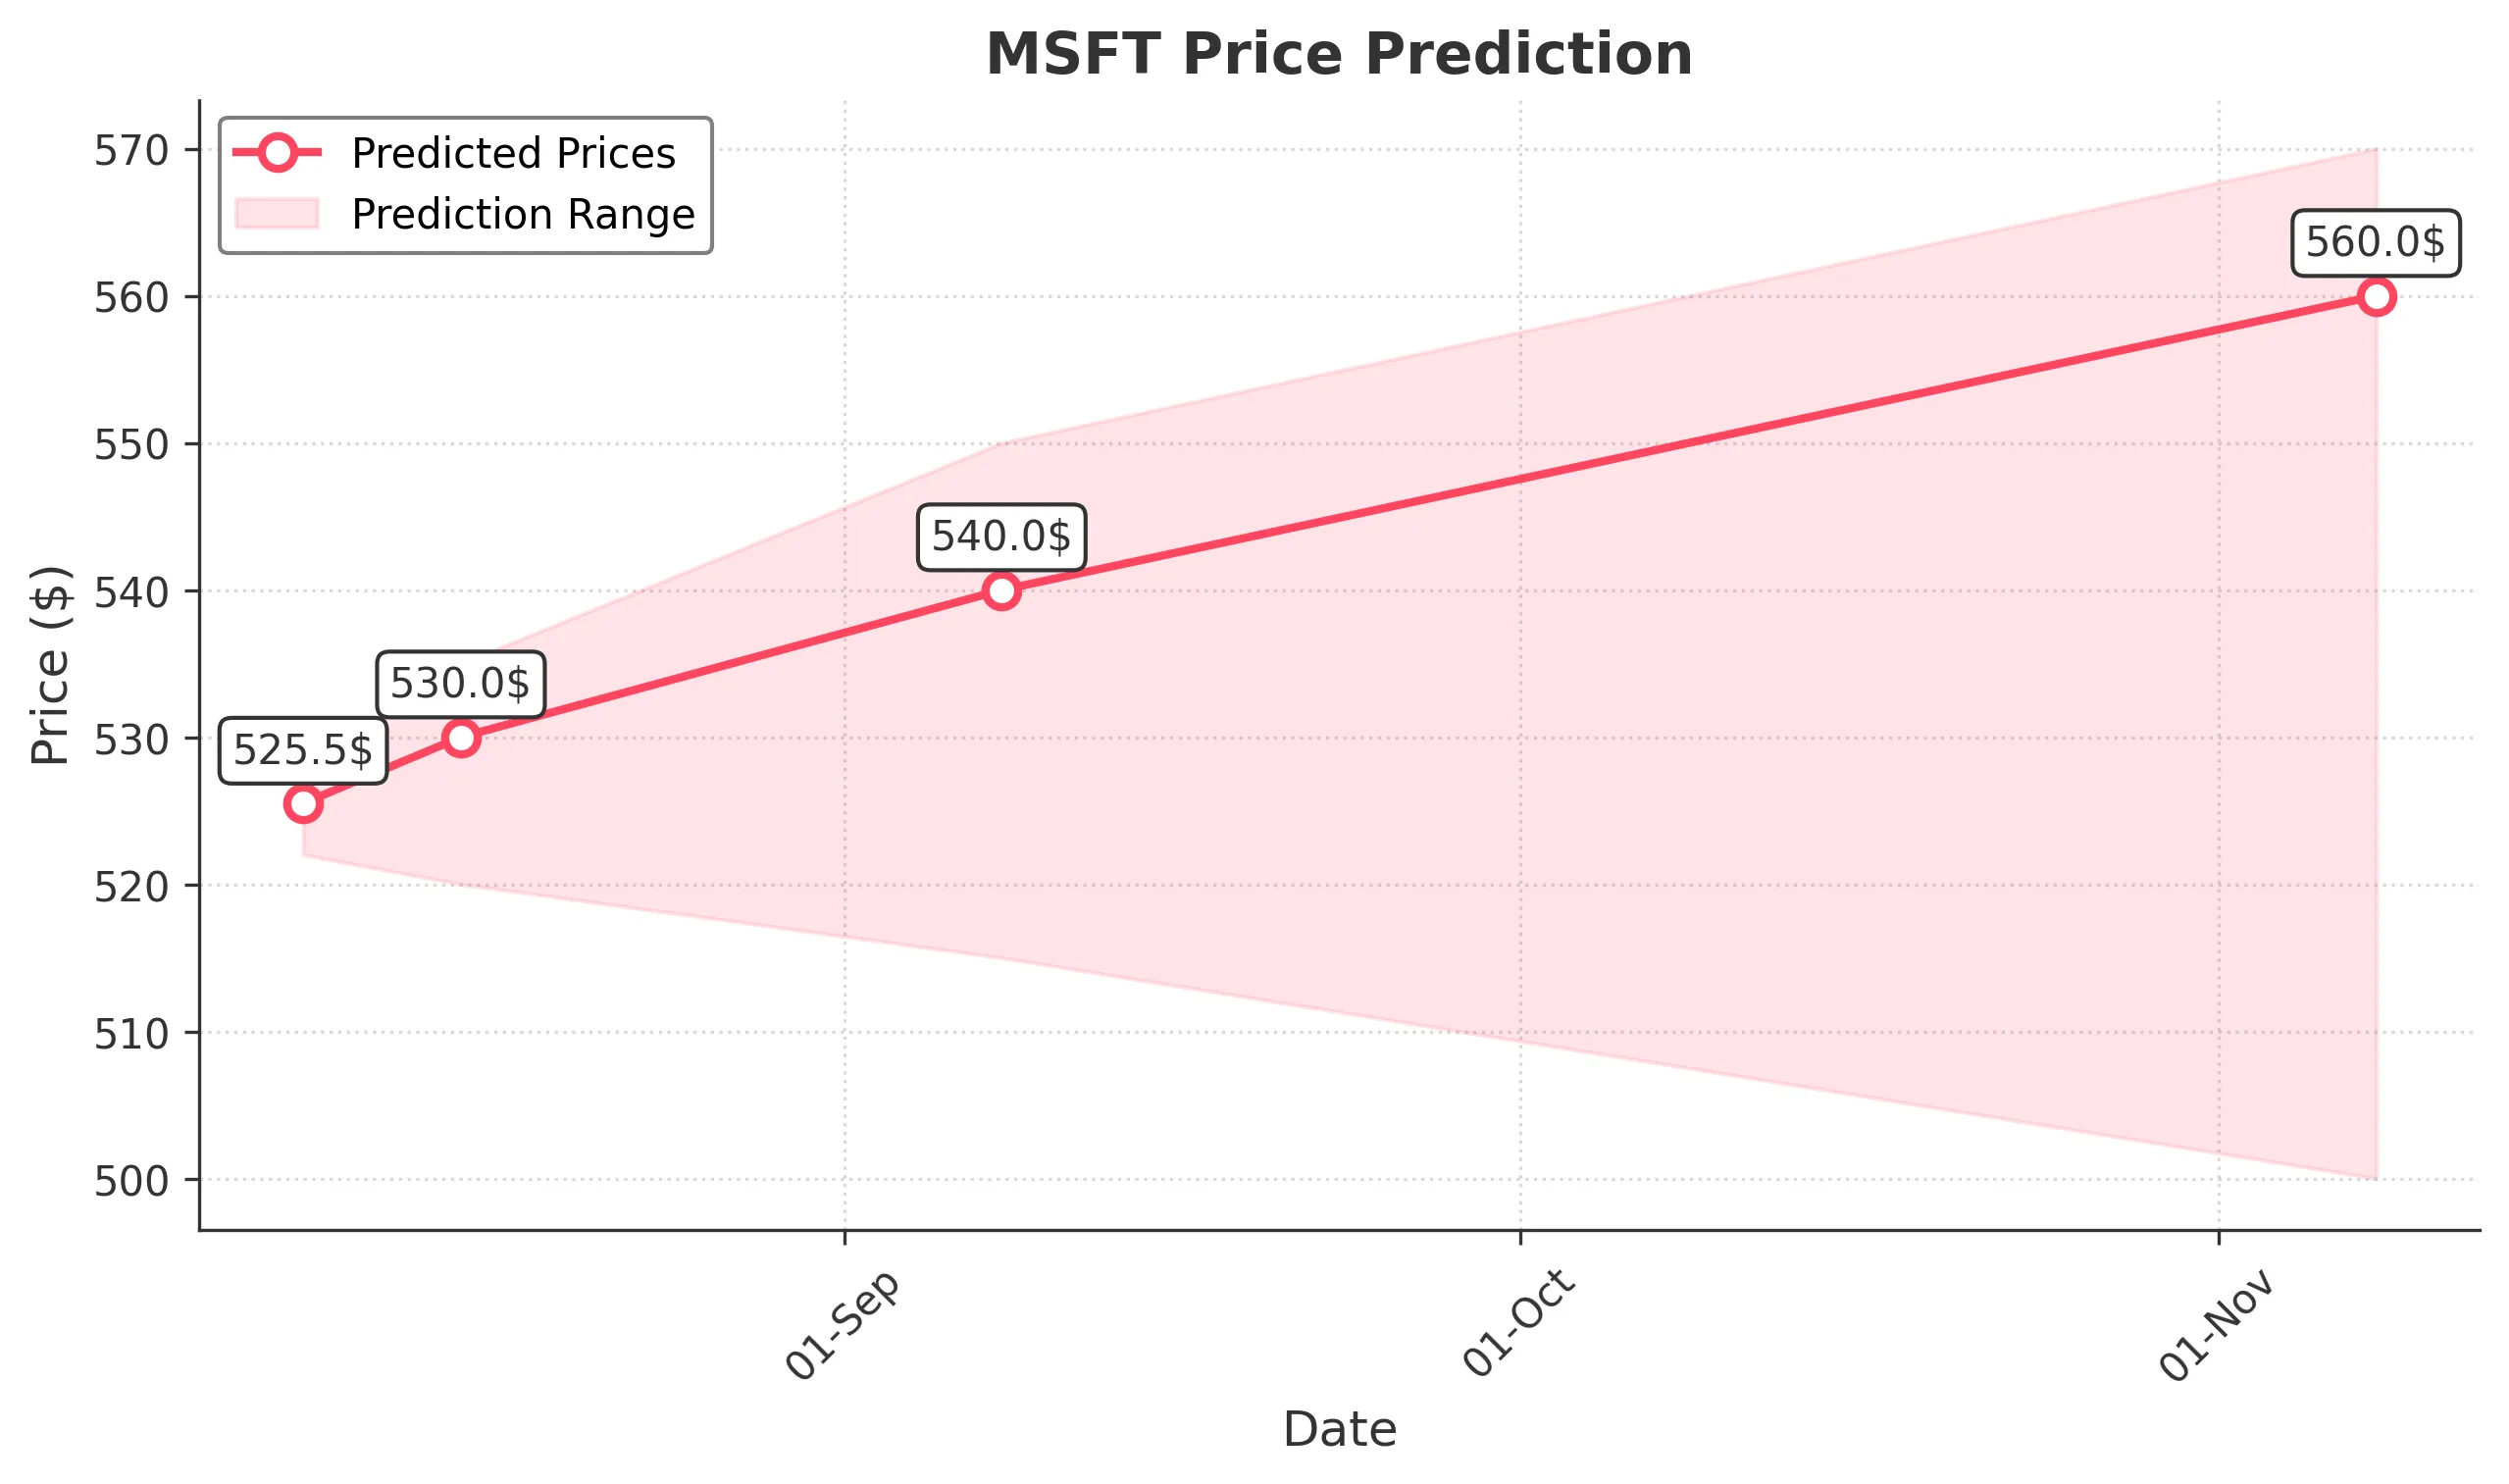
Target: August 8, 2025$525.5
$524.940002
$528
$522
Description
The stock shows a slight bullish trend with a recent Doji pattern indicating indecision. RSI is near 60, suggesting potential upward momentum. However, MACD is flattening, indicating possible consolidation. Volume is expected to be moderate.
Analysis
Over the past 3 months, MSFT has shown a bullish trend with significant upward movement, reaching a peak of 555.45. Key support is around 510, while resistance is near 550. Volume has been increasing, indicating strong interest. Technical indicators suggest potential consolidation.
Confidence Level
Potential Risks
Market sentiment could shift due to macroeconomic news or earnings reports, which may impact the stock's performance.
1 Week Prediction
Target: August 15, 2025$530
$525.5
$535
$520
Description
The stock is expected to continue its upward trajectory, supported by a bullish MACD crossover. RSI remains healthy, indicating strength. However, the recent high may act as resistance, and profit-taking could occur.
Analysis
MSFT has been on a bullish run, with strong volume supporting price increases. The stock has recently broken through key resistance levels, but caution is warranted as it approaches previous highs. Technical indicators suggest continued strength, but external factors could introduce risk.
Confidence Level
Potential Risks
Potential market corrections or negative news could lead to volatility, impacting the predicted price.
1 Month Prediction
Target: September 8, 2025$540
$530
$550
$515
Description
The stock is likely to maintain its bullish trend, with strong fundamentals supporting growth. Fibonacci retracement levels suggest potential resistance at 550. Market sentiment remains positive, but caution is advised as it approaches this level.
Analysis
MSFT has shown resilience with a strong upward trend. Key support is at 520, while resistance is at 550. The stock's performance is bolstered by positive market sentiment and strong volume. However, external economic factors could introduce uncertainty.
Confidence Level
Potential Risks
Economic indicators or earnings reports could lead to unexpected volatility, affecting the stock's trajectory.
3 Months Prediction
Target: November 8, 2025$560
$540
$570
$500
Description
Long-term bullish sentiment is expected to drive the stock higher, supported by strong earnings and market demand. However, potential resistance at 570 may lead to profit-taking. Watch for macroeconomic developments that could impact growth.
Analysis
MSFT has demonstrated a strong bullish trend over the past three months, with significant price increases. Key support is at 500, while resistance is at 570. Technical indicators suggest continued strength, but external factors could lead to volatility.
Confidence Level
Potential Risks
Market corrections or geopolitical events could introduce significant volatility, impacting the stock's performance.