MSFT Trading Predictions
1 Day Prediction
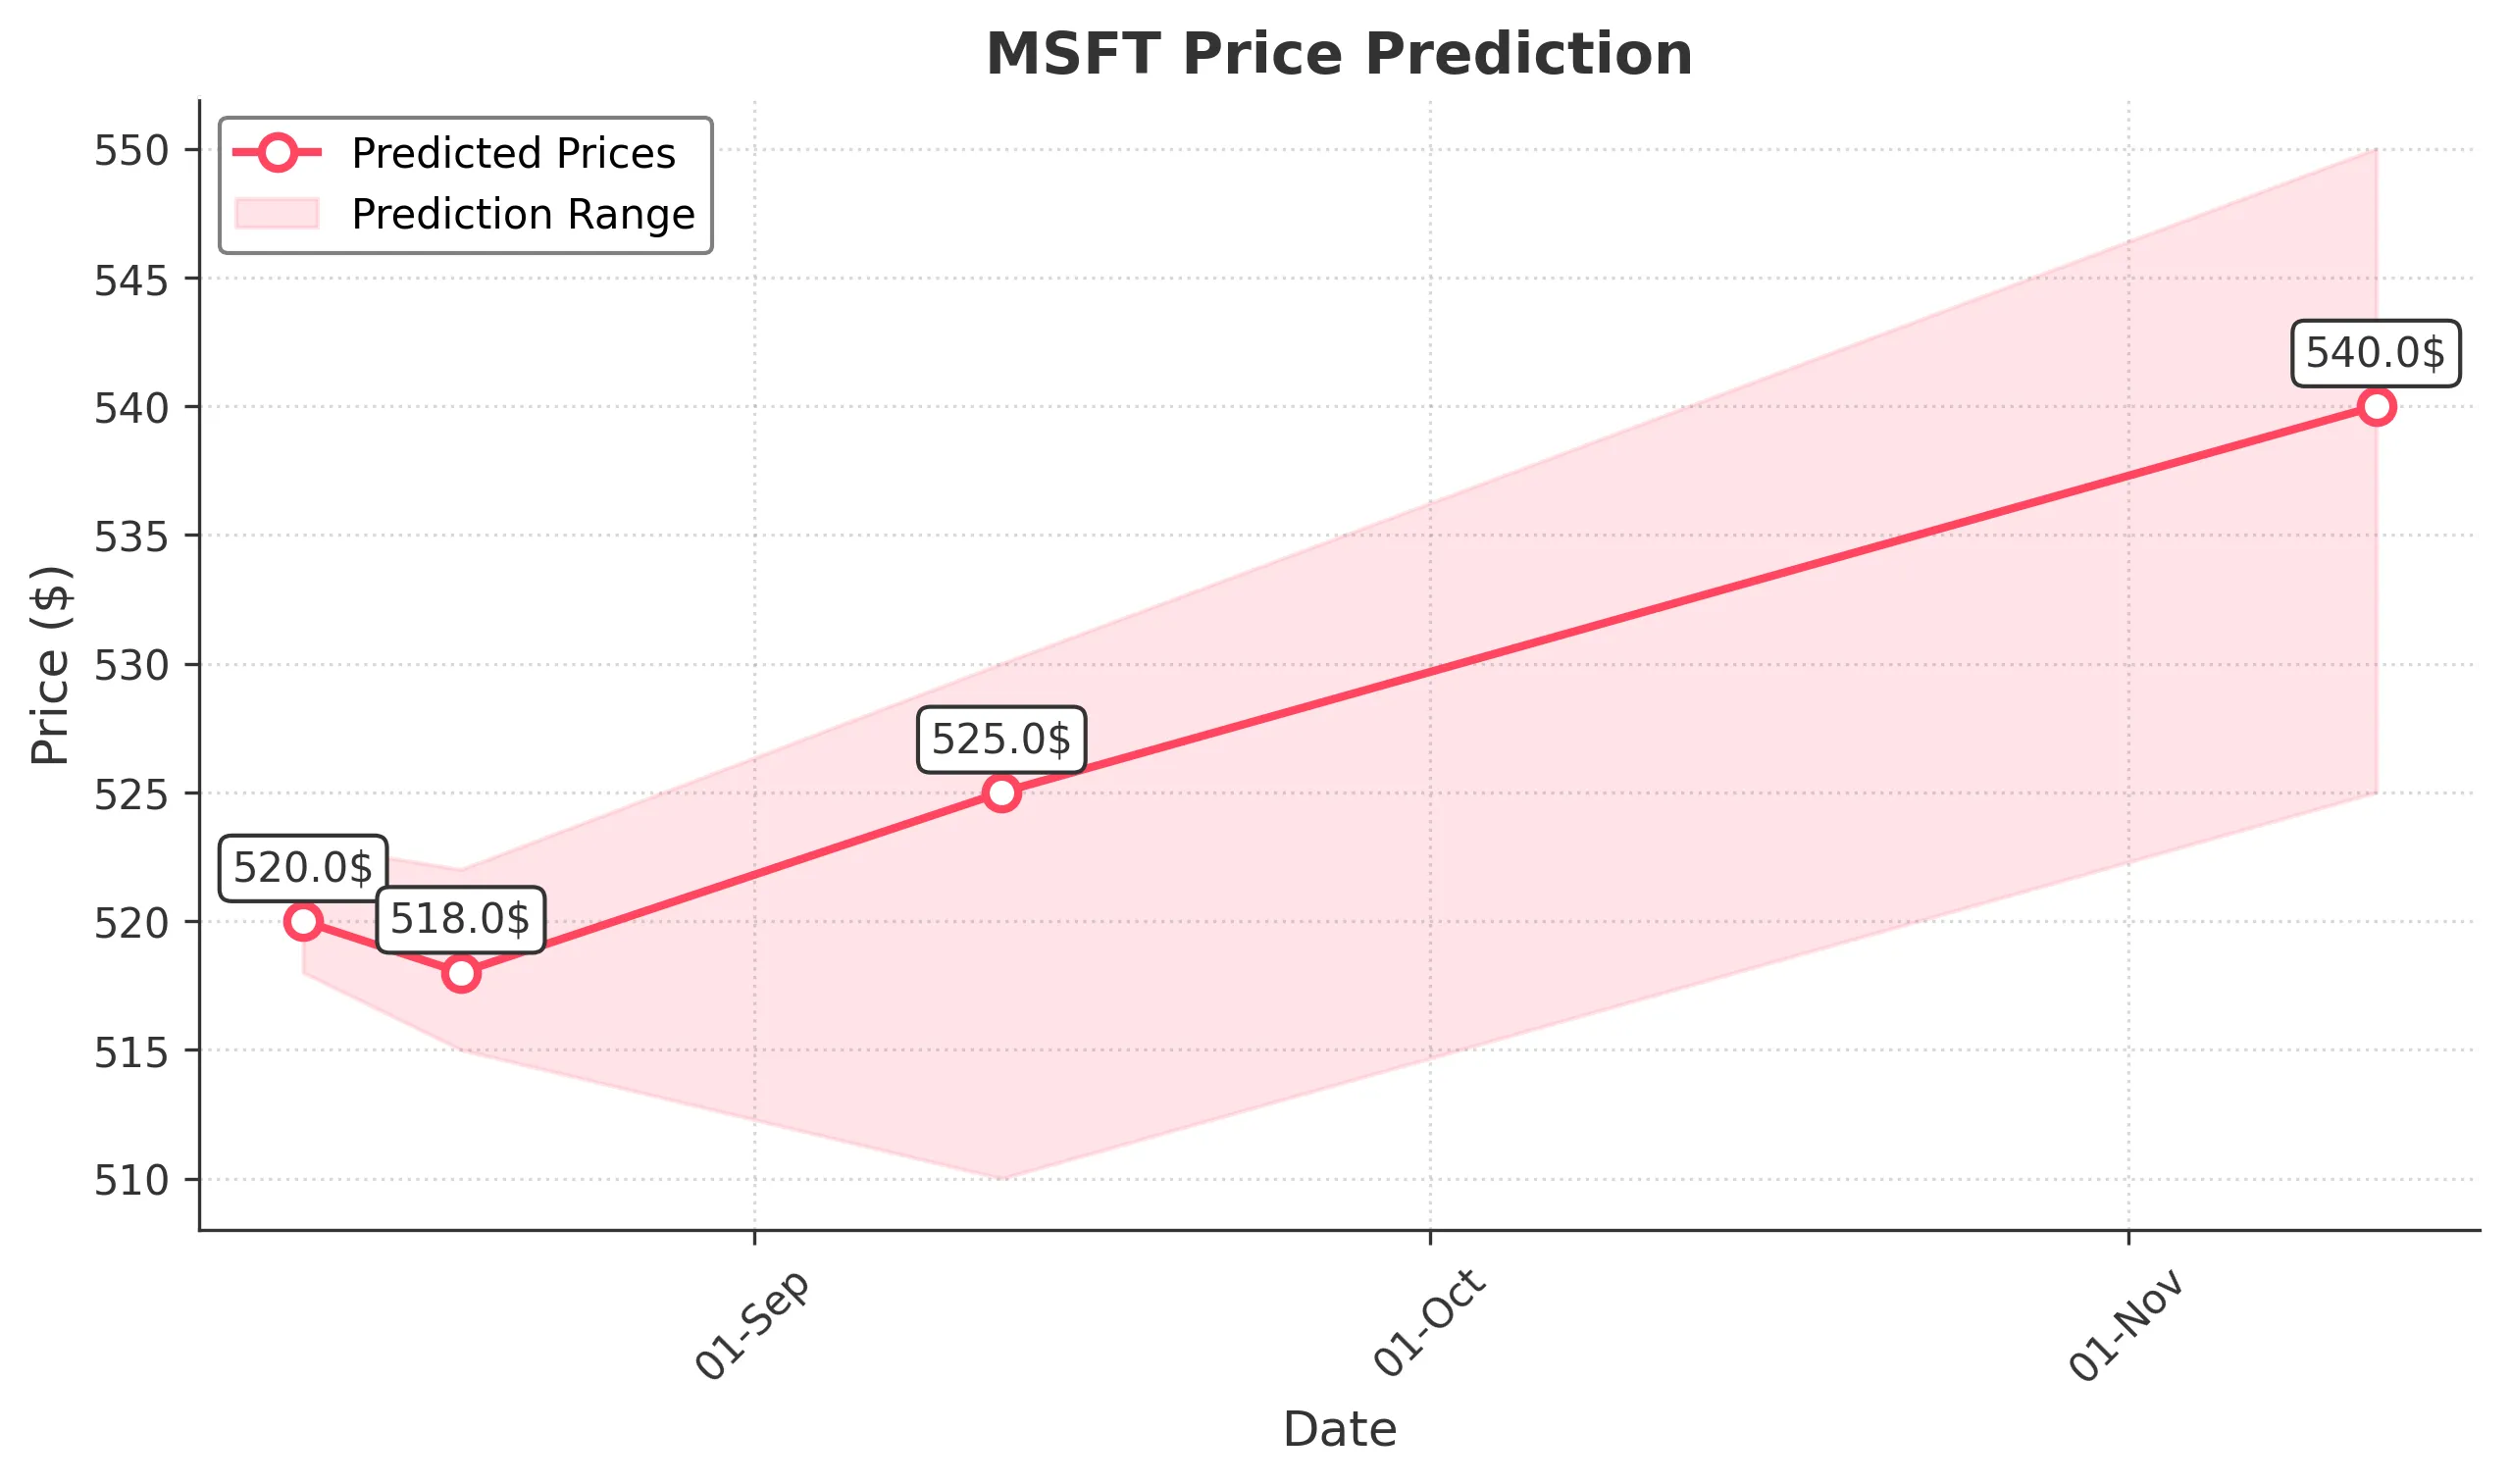
Target: August 12, 2025$520
$520.5
$523
$518
Description
The stock shows a slight bearish trend with recent lower highs and a Doji candlestick pattern indicating indecision. RSI is near 50, suggesting a potential pullback. Volume is decreasing, indicating weakening momentum.
Analysis
Over the past 3 months, MSFT has shown a bullish trend with significant upward movement, reaching a peak of 533.50. However, recent price action indicates a potential reversal with lower highs and increased volatility. Key support is around 510, while resistance is at 550. The RSI is neutral, and MACD shows a bearish crossover.
Confidence Level
Potential Risks
Market sentiment could shift due to macroeconomic news or earnings reports, which may impact the prediction.
1 Week Prediction
Target: August 19, 2025$518
$519
$522
$515
Description
The stock is expected to consolidate around current levels, with potential for a slight decline. The Bollinger Bands are tightening, indicating reduced volatility. A bearish engulfing pattern suggests caution.
Analysis
MSFT has experienced a strong rally but is now facing resistance. The recent price action shows signs of exhaustion, with the RSI approaching overbought levels. Volume has been inconsistent, and the ATR indicates increasing volatility, suggesting potential for both upward and downward movements.
Confidence Level
Potential Risks
Unforeseen market events or earnings surprises could lead to significant price movements contrary to the prediction.
1 Month Prediction
Target: September 12, 2025$525
$520
$530
$510
Description
Expect a gradual recovery as the stock finds support at 510. The Fibonacci retracement levels suggest a bounce back towards 525. The MACD is showing signs of bullish divergence.
Analysis
The stock has shown resilience despite recent volatility. Key support at 510 has held, and the overall trend remains bullish. The RSI is stabilizing, and the MACD indicates potential upward momentum. However, caution is warranted as external factors could influence performance.
Confidence Level
Potential Risks
Economic indicators or changes in market sentiment could impact the stock's recovery trajectory.
3 Months Prediction
Target: November 12, 2025$540
$530
$550
$525
Description
Long-term outlook remains positive with potential for growth as the market stabilizes. The stock may test resistance at 550, supported by strong fundamentals and positive market sentiment.
Analysis
MSFT has shown a strong upward trend over the past three months, with significant support at 510 and resistance at 550. The overall market sentiment is cautiously optimistic, but external economic factors could introduce volatility. The stock's fundamentals remain strong, supporting a bullish outlook.
Confidence Level
Potential Risks
Market volatility and economic conditions could lead to unexpected downturns, affecting the stock's performance.