MSFT Trading Predictions
1 Day Prediction
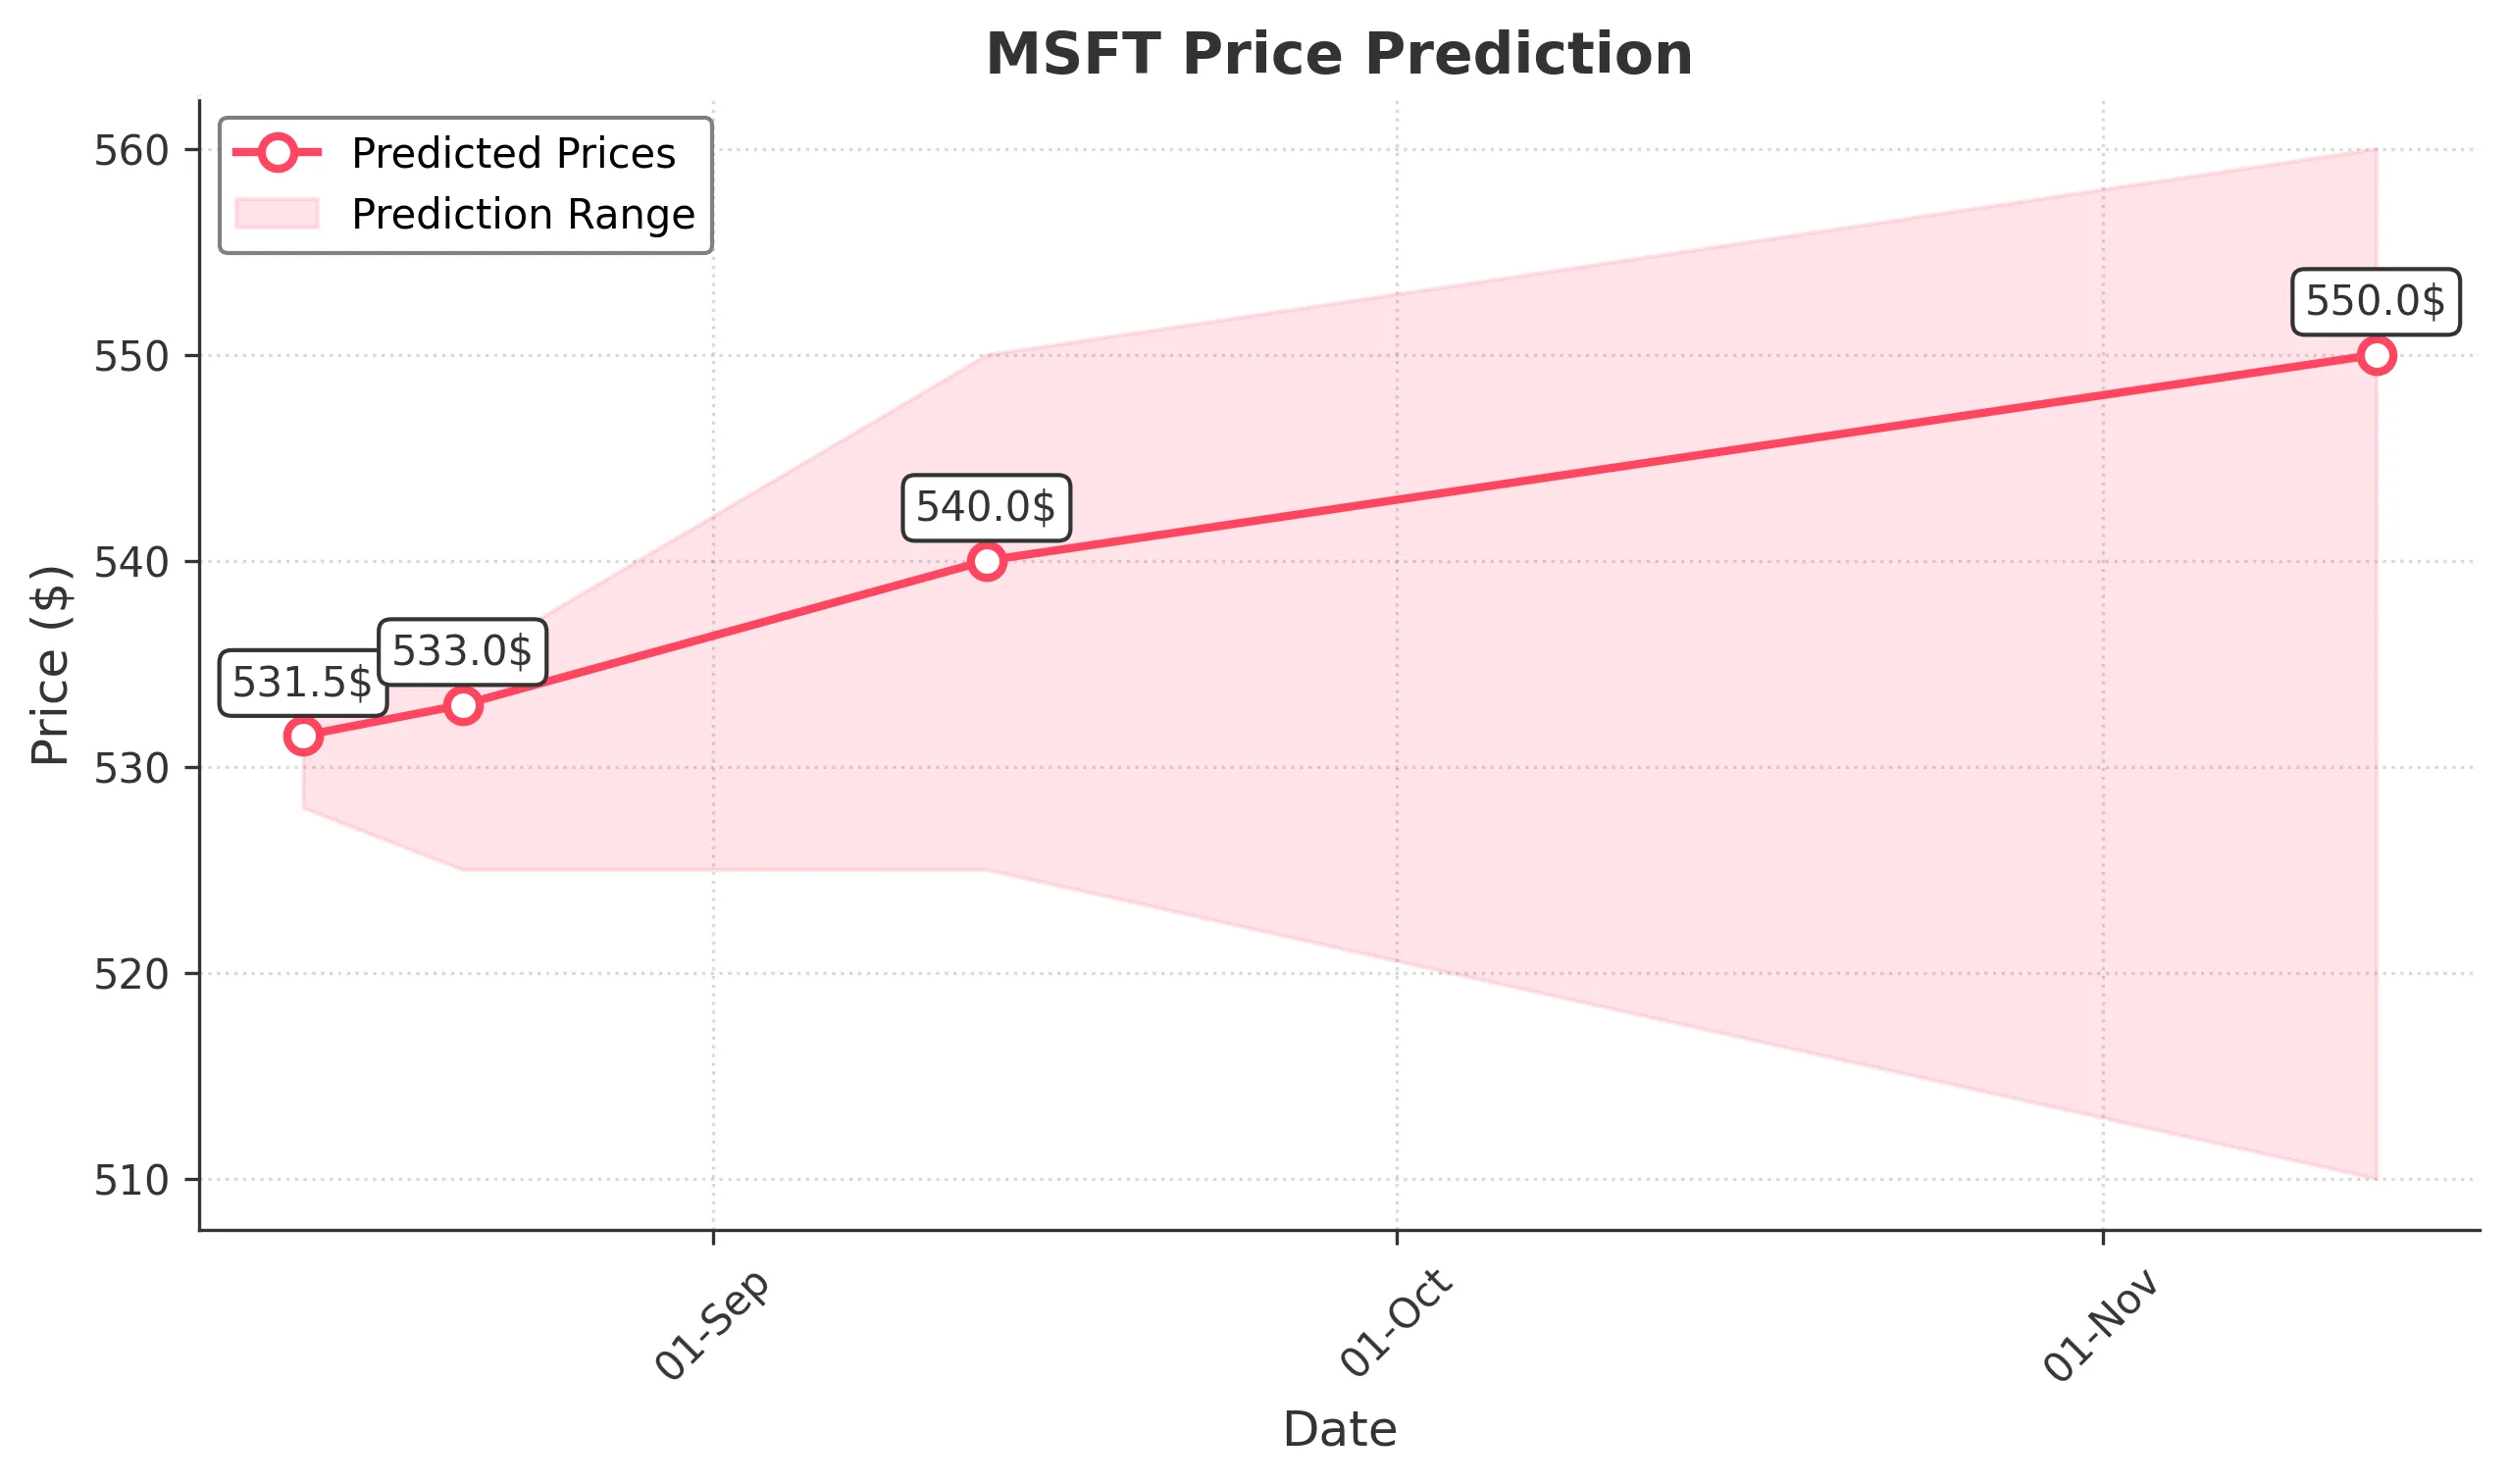
Target: August 14, 2025$531.5
$530
$533
$528
Description
The stock shows a bullish trend with a recent Doji pattern indicating indecision. The RSI is near 60, suggesting upward momentum. However, MACD is flattening, indicating potential consolidation. Volume is expected to be moderate as traders await further direction.
Analysis
Over the past 3 months, MSFT has shown a bullish trend with significant upward movement, especially after breaking resistance at $500. Key support is around $520. The RSI indicates strength, but recent candlestick patterns suggest caution as the stock approaches overbought territory.
Confidence Level
Potential Risks
Potential market volatility due to macroeconomic news could impact the prediction.
1 Week Prediction
Target: August 21, 2025$533
$530
$535
$525
Description
The stock is expected to maintain its bullish trend, supported by strong earnings sentiment. The MACD remains positive, and the Bollinger Bands suggest a continuation of the upward movement. However, a pullback could occur if the RSI exceeds 70.
Analysis
MSFT has been on a strong upward trajectory, with recent highs indicating robust demand. The stock has broken through key resistance levels, but caution is warranted as it approaches overbought conditions. Volume patterns suggest strong interest, but any negative news could trigger a correction.
Confidence Level
Potential Risks
Market sentiment could shift due to external economic factors, leading to unexpected volatility.
1 Month Prediction
Target: September 13, 2025$540
$535
$550
$525
Description
The stock is likely to continue its upward trend, driven by positive earnings reports and strong market sentiment. The Fibonacci retracement levels suggest potential resistance at $550, while support remains at $525. Watch for any bearish divergence in RSI.
Analysis
MSFT has shown resilience with a strong bullish trend. Key support at $525 and resistance at $550 are critical levels to watch. The stock's performance is bolstered by positive market sentiment, but external factors could lead to fluctuations. Volume analysis indicates sustained interest.
Confidence Level
Potential Risks
Economic indicators and geopolitical events could introduce volatility, impacting the stock's performance.
3 Months Prediction
Target: November 13, 2025$550
$540
$560
$510
Description
The stock is expected to face resistance around $560, with potential for a pullback if market conditions shift. The MACD may show signs of weakening momentum, and the RSI could indicate overbought conditions. Volume may increase as traders react to earnings.
Analysis
MSFT's performance over the past three months has been strong, with a clear bullish trend. However, as it approaches key resistance levels, the risk of a pullback increases. The stock's volatility may rise due to external economic factors, and traders should remain cautious.
Confidence Level
Potential Risks
Unforeseen macroeconomic events or earnings surprises could lead to significant price adjustments.