MSFT Trading Predictions
1 Day Prediction
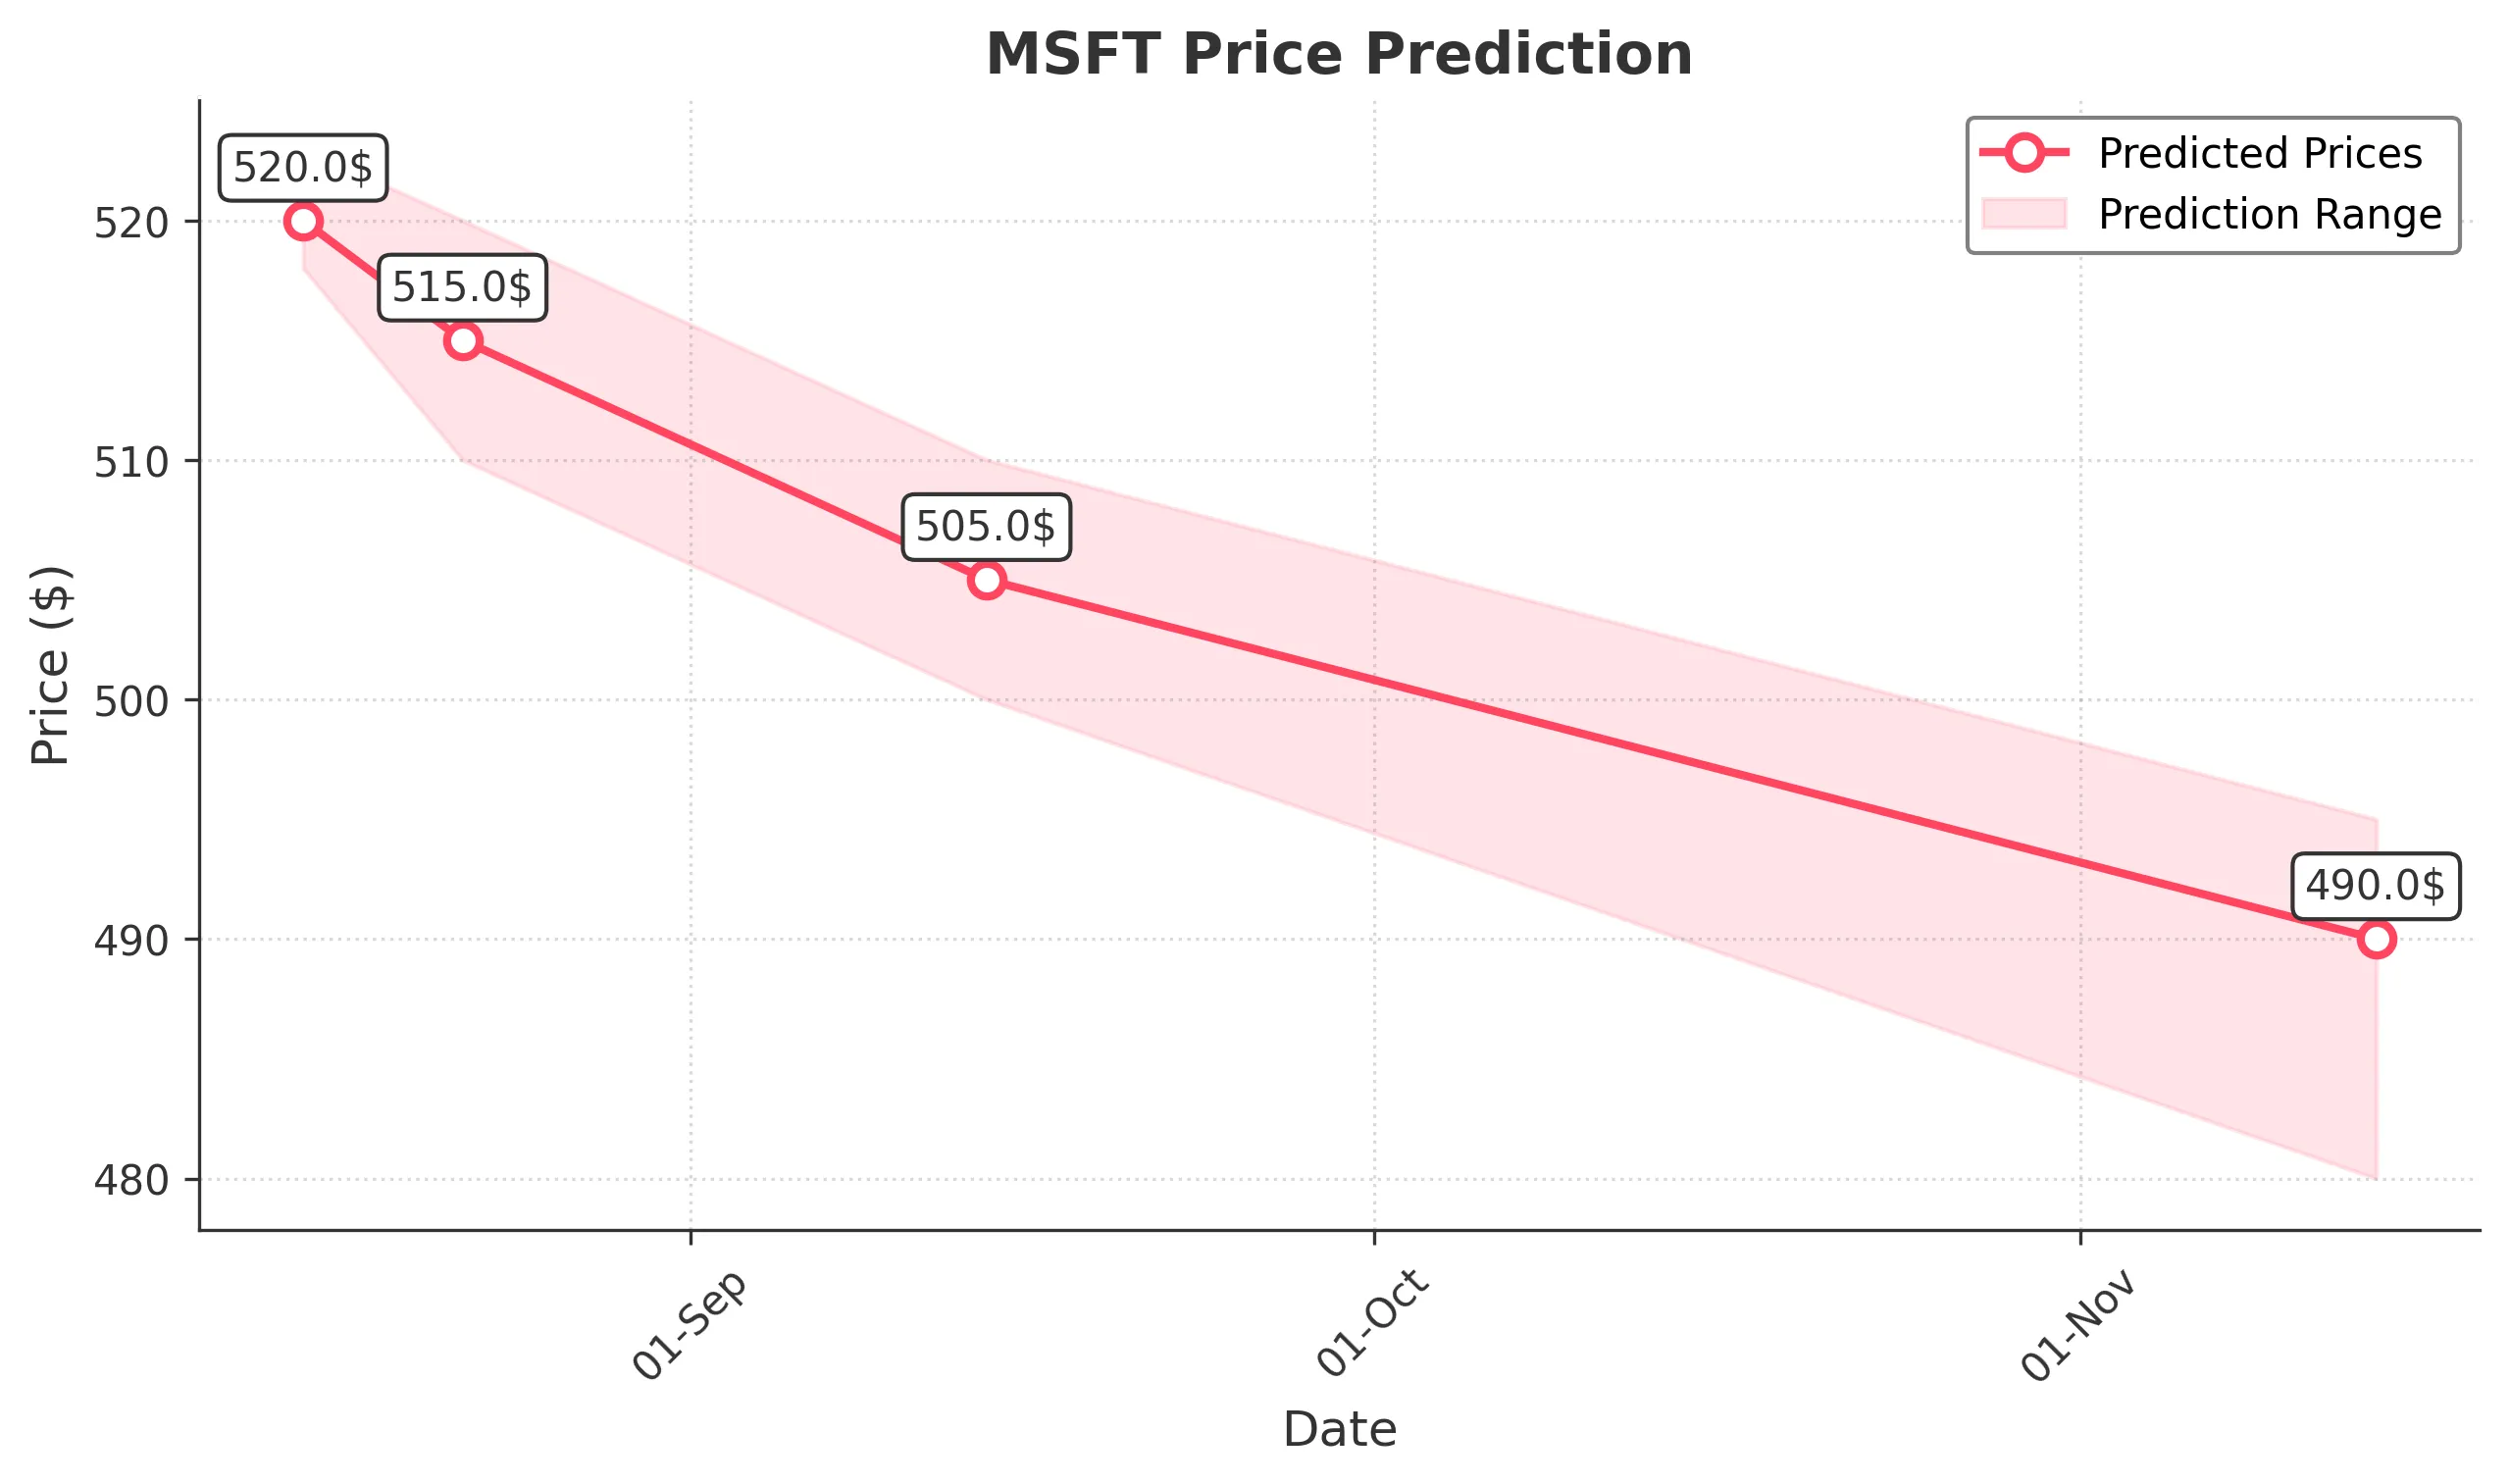
Target: August 15, 2025$520
$520.5
$523
$518
Description
The stock shows a slight bearish trend with recent lower highs and a Doji pattern indicating indecision. RSI is near 50, suggesting a potential pullback. Volume is decreasing, indicating weakening momentum.
Analysis
Over the past 3 months, MSFT has shown a bullish trend with significant upward movement, reaching a peak of 533.50. However, recent price action indicates a potential reversal with lower highs and increased volatility. Key support is around 510, while resistance is at 550. Volume patterns suggest a decrease in buying interest.
Confidence Level
Potential Risks
Market sentiment could shift due to macroeconomic news or earnings reports, which may impact the prediction.
1 Week Prediction
Target: August 22, 2025$515
$518
$520
$510
Description
The stock may continue to face downward pressure as the MACD shows a bearish crossover. The Bollinger Bands are tightening, indicating potential volatility. A Fibonacci retracement level at 515 could act as support.
Analysis
MSFT has experienced a strong rally but is now showing signs of consolidation. The recent price action suggests a potential correction. Key support levels are at 510, while resistance remains at 550. The RSI indicates a neutral stance, and volume has been inconsistent, reflecting uncertainty.
Confidence Level
Potential Risks
Unforeseen market events or earnings surprises could lead to significant price fluctuations.
1 Month Prediction
Target: September 14, 2025$505
$508
$510
$500
Description
A bearish trend is anticipated as the stock approaches key support levels. The RSI indicates oversold conditions, but a rebound may be limited. The market sentiment is cautious, and external factors could weigh on performance.
Analysis
The stock has shown a strong bullish trend but is now facing resistance. The recent price action suggests a potential downturn, with key support at 500. The MACD is bearish, and volume patterns indicate a lack of strong buying interest. Market sentiment is mixed, with external factors potentially influencing price.
Confidence Level
Potential Risks
Economic indicators and earnings reports could significantly impact the stock's trajectory.
3 Months Prediction
Target: November 14, 2025$490
$485
$495
$480
Description
The stock may continue to decline as bearish signals persist. The MACD remains negative, and the RSI indicates oversold conditions. A potential bounce could occur, but overall sentiment is bearish.
Analysis
Over the past three months, MSFT has shown a strong upward trend but is now facing significant resistance. The stock's performance is influenced by macroeconomic factors, and the recent price action suggests a potential correction. Key support is at 480, while resistance is at 550. The overall market sentiment is cautious.
Confidence Level
Potential Risks
Market volatility and economic conditions could lead to unexpected price movements.