NFLX Trading Predictions
1 Day Prediction
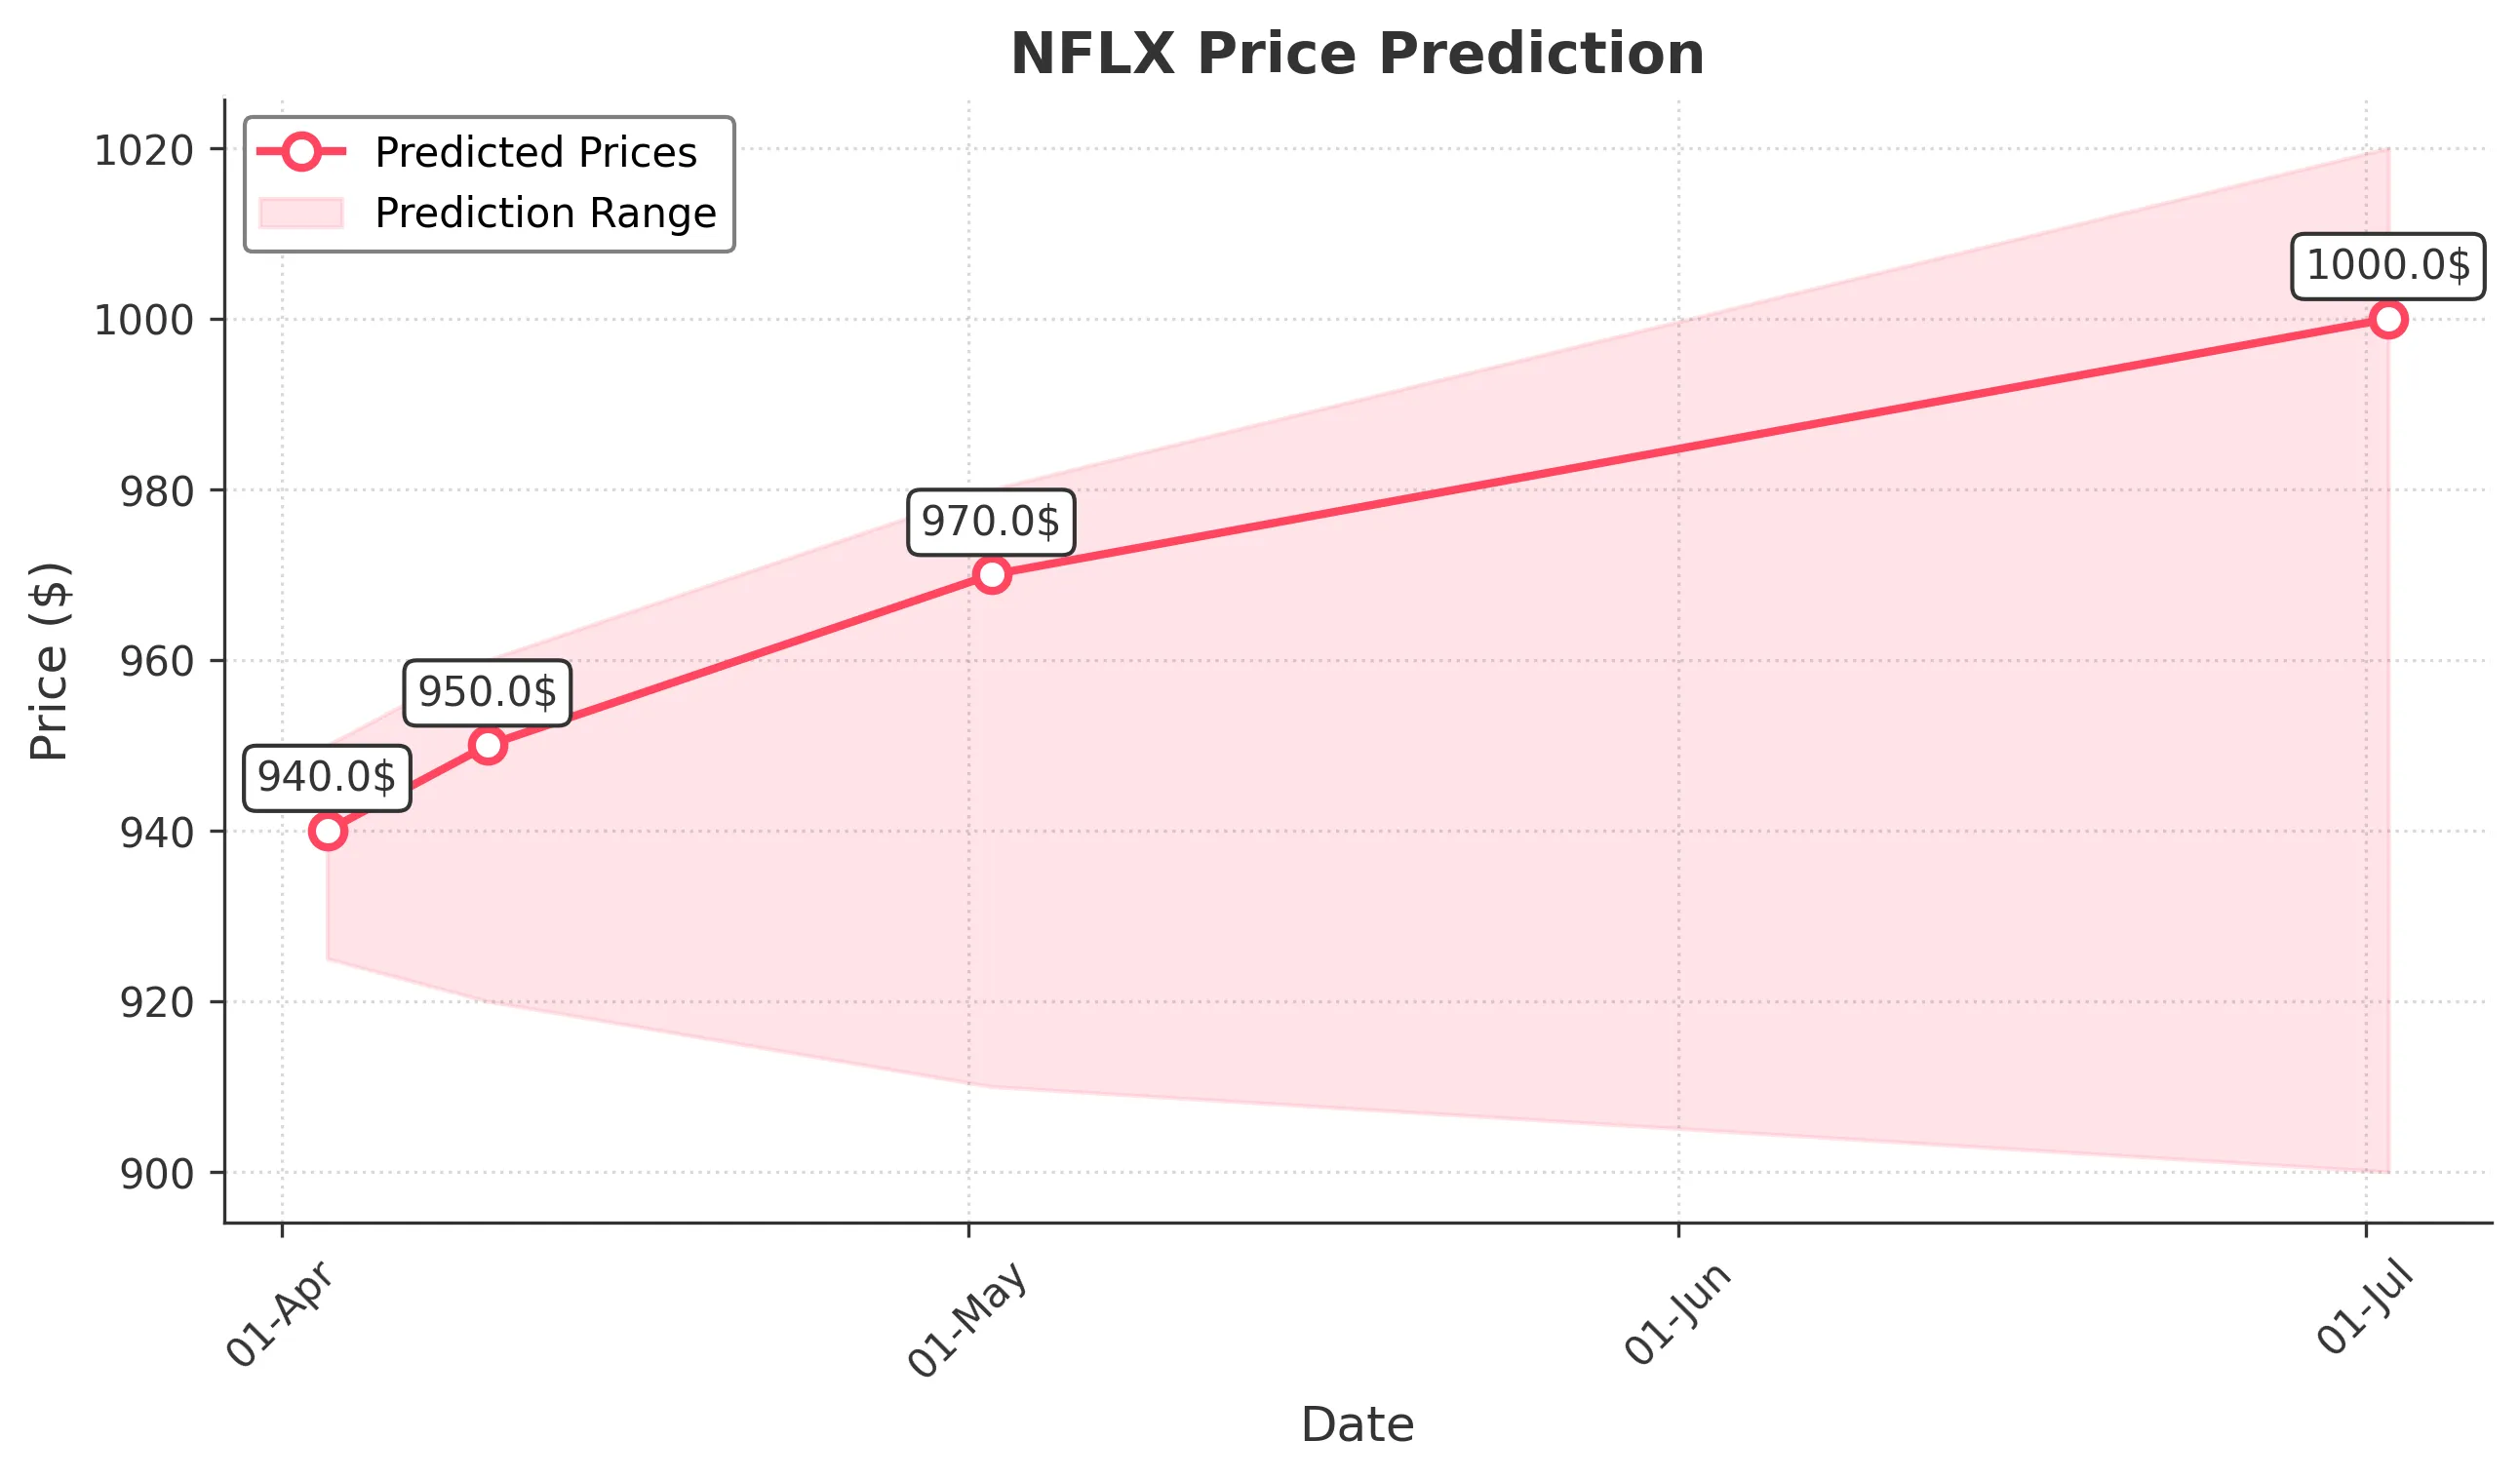
Target: April 3, 2025$940
$935
$950
$925
Description
The stock shows a slight bullish trend with a recent bounce off support at 928. The RSI indicates oversold conditions, suggesting a potential upward movement. However, volatility remains high, and market sentiment is mixed.
Analysis
Over the past 3 months, NFLX has shown a bearish trend with significant fluctuations. Key support is at 928, while resistance is around 950. The MACD is showing a bearish crossover, and volume spikes indicate uncertainty. Recent candlestick patterns suggest indecision.
Confidence Level
Potential Risks
Market volatility and external news could impact the prediction. A sudden downturn is possible if bearish sentiment prevails.
1 Week Prediction
Target: April 10, 2025$950
$940
$960
$920
Description
A potential recovery is indicated as the stock approaches resistance at 950. The MACD shows signs of bullish momentum, and the RSI is improving. However, the market remains sensitive to macroeconomic factors.
Analysis
The stock has been in a bearish phase, with recent attempts to recover. Key support at 928 has held, but resistance at 950 is significant. Volume analysis shows increased activity, indicating potential interest from buyers.
Confidence Level
Potential Risks
Unforeseen macroeconomic events or earnings reports could lead to volatility. The bearish trend may resume if resistance holds.
1 Month Prediction
Target: May 2, 2025$970
$950
$980
$910
Description
If the bullish momentum continues, the stock could reach 970, supported by improving RSI and MACD indicators. However, resistance at 980 may pose challenges.
Analysis
The stock has shown mixed signals with a recent bounce from support. The MACD is showing potential bullish divergence, but the overall trend remains uncertain. Volume patterns indicate indecision among traders.
Confidence Level
Potential Risks
Market sentiment is volatile, and external factors could reverse the trend. A failure to break resistance could lead to a pullback.
3 Months Prediction
Target: July 2, 2025$1000
$970
$1020
$900
Description
If the bullish trend continues, the stock could reach 1000, driven by positive earnings and market sentiment. However, resistance levels will need to be monitored closely.
Analysis
The stock has experienced significant volatility, with a bearish trend recently. Key resistance at 1000 will be critical. The overall market sentiment is cautious, and external economic factors could heavily influence future performance.
Confidence Level
Potential Risks
Long-term predictions are uncertain due to potential market corrections and economic factors that could impact performance.