NFLX Trading Predictions
1 Day Prediction
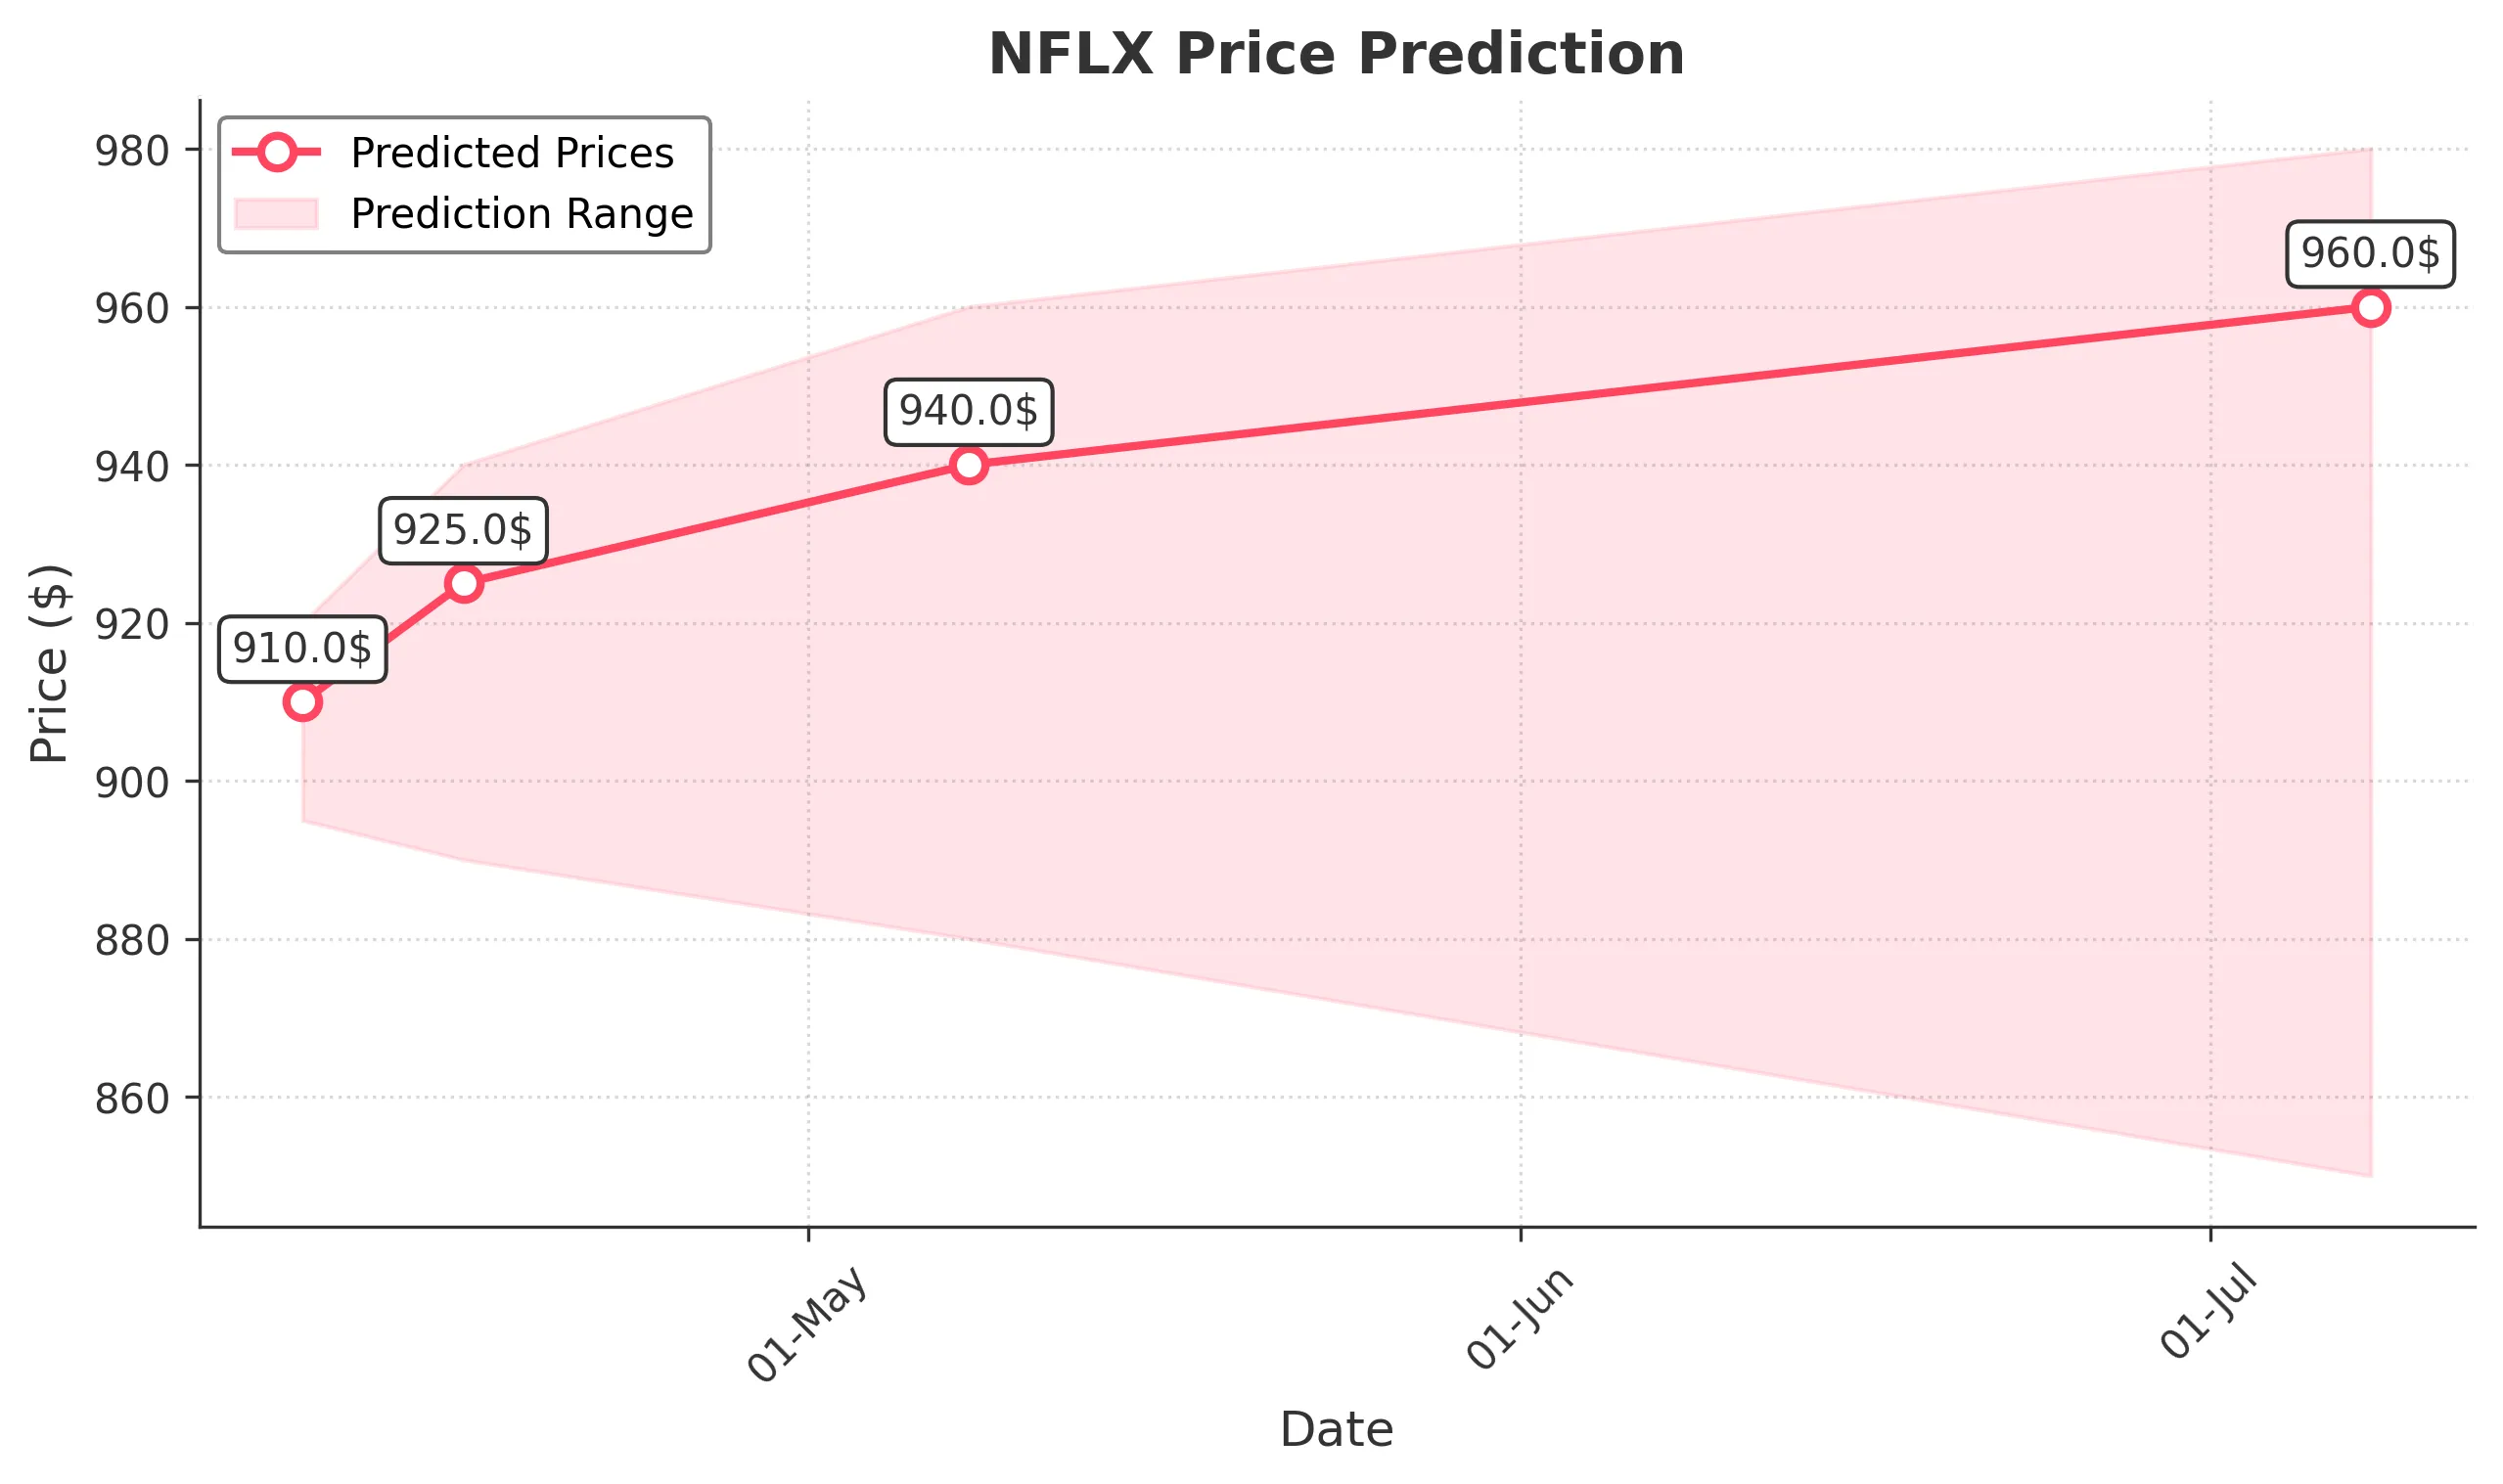
Target: April 9, 2025$910
$908
$920
$895
Description
The stock shows a slight bullish trend with a recent Doji candlestick indicating indecision. The RSI is around 50, suggesting a neutral momentum. A potential bounce from support at 900 could lead to a close around 910.
Analysis
Over the past 3 months, NFLX has shown a bearish trend with significant fluctuations. Key support is at 900, while resistance is around 950. The MACD is bearish, and volume has been inconsistent, indicating uncertainty in market sentiment.
Confidence Level
Potential Risks
Market volatility and external news could impact the price significantly.
1 Week Prediction
Target: April 16, 2025$925
$910
$940
$890
Description
A potential recovery is indicated as the stock approaches a Fibonacci retracement level at 925. The MACD shows signs of convergence, suggesting a bullish reversal. However, the RSI remains neutral, indicating caution.
Analysis
The stock has been in a bearish phase, with recent attempts to recover. Key resistance at 950 remains a challenge. Volume spikes on down days suggest selling pressure, while the ATR indicates increased volatility.
Confidence Level
Potential Risks
Unforeseen macroeconomic events could lead to volatility, impacting the prediction.
1 Month Prediction
Target: May 8, 2025$940
$925
$960
$880
Description
The stock may stabilize around 940 as it approaches a key resistance level. The Bollinger Bands indicate potential for a breakout, but the RSI suggests overbought conditions, which could lead to a pullback.
Analysis
NFLX has shown a mixed performance with bearish tendencies. The recent price action indicates a struggle to maintain upward momentum. Key support at 900 and resistance at 950 are critical levels to watch.
Confidence Level
Potential Risks
Market sentiment and earnings reports could significantly alter the stock's trajectory.
3 Months Prediction
Target: July 8, 2025$960
$940
$980
$850
Description
A potential bullish trend may develop if the stock breaks above 950. The MACD could turn positive, and if volume increases, it may signal a strong upward move. However, macroeconomic factors remain a risk.
Analysis
The stock has been volatile, with a bearish trend recently. Key resistance at 950 and support at 900 are crucial. The overall market sentiment is cautious, and external factors could heavily influence future performance.
Confidence Level
Potential Risks
Long-term predictions are uncertain due to potential market shifts and economic conditions.