NFLX Trading Predictions
1 Day Prediction
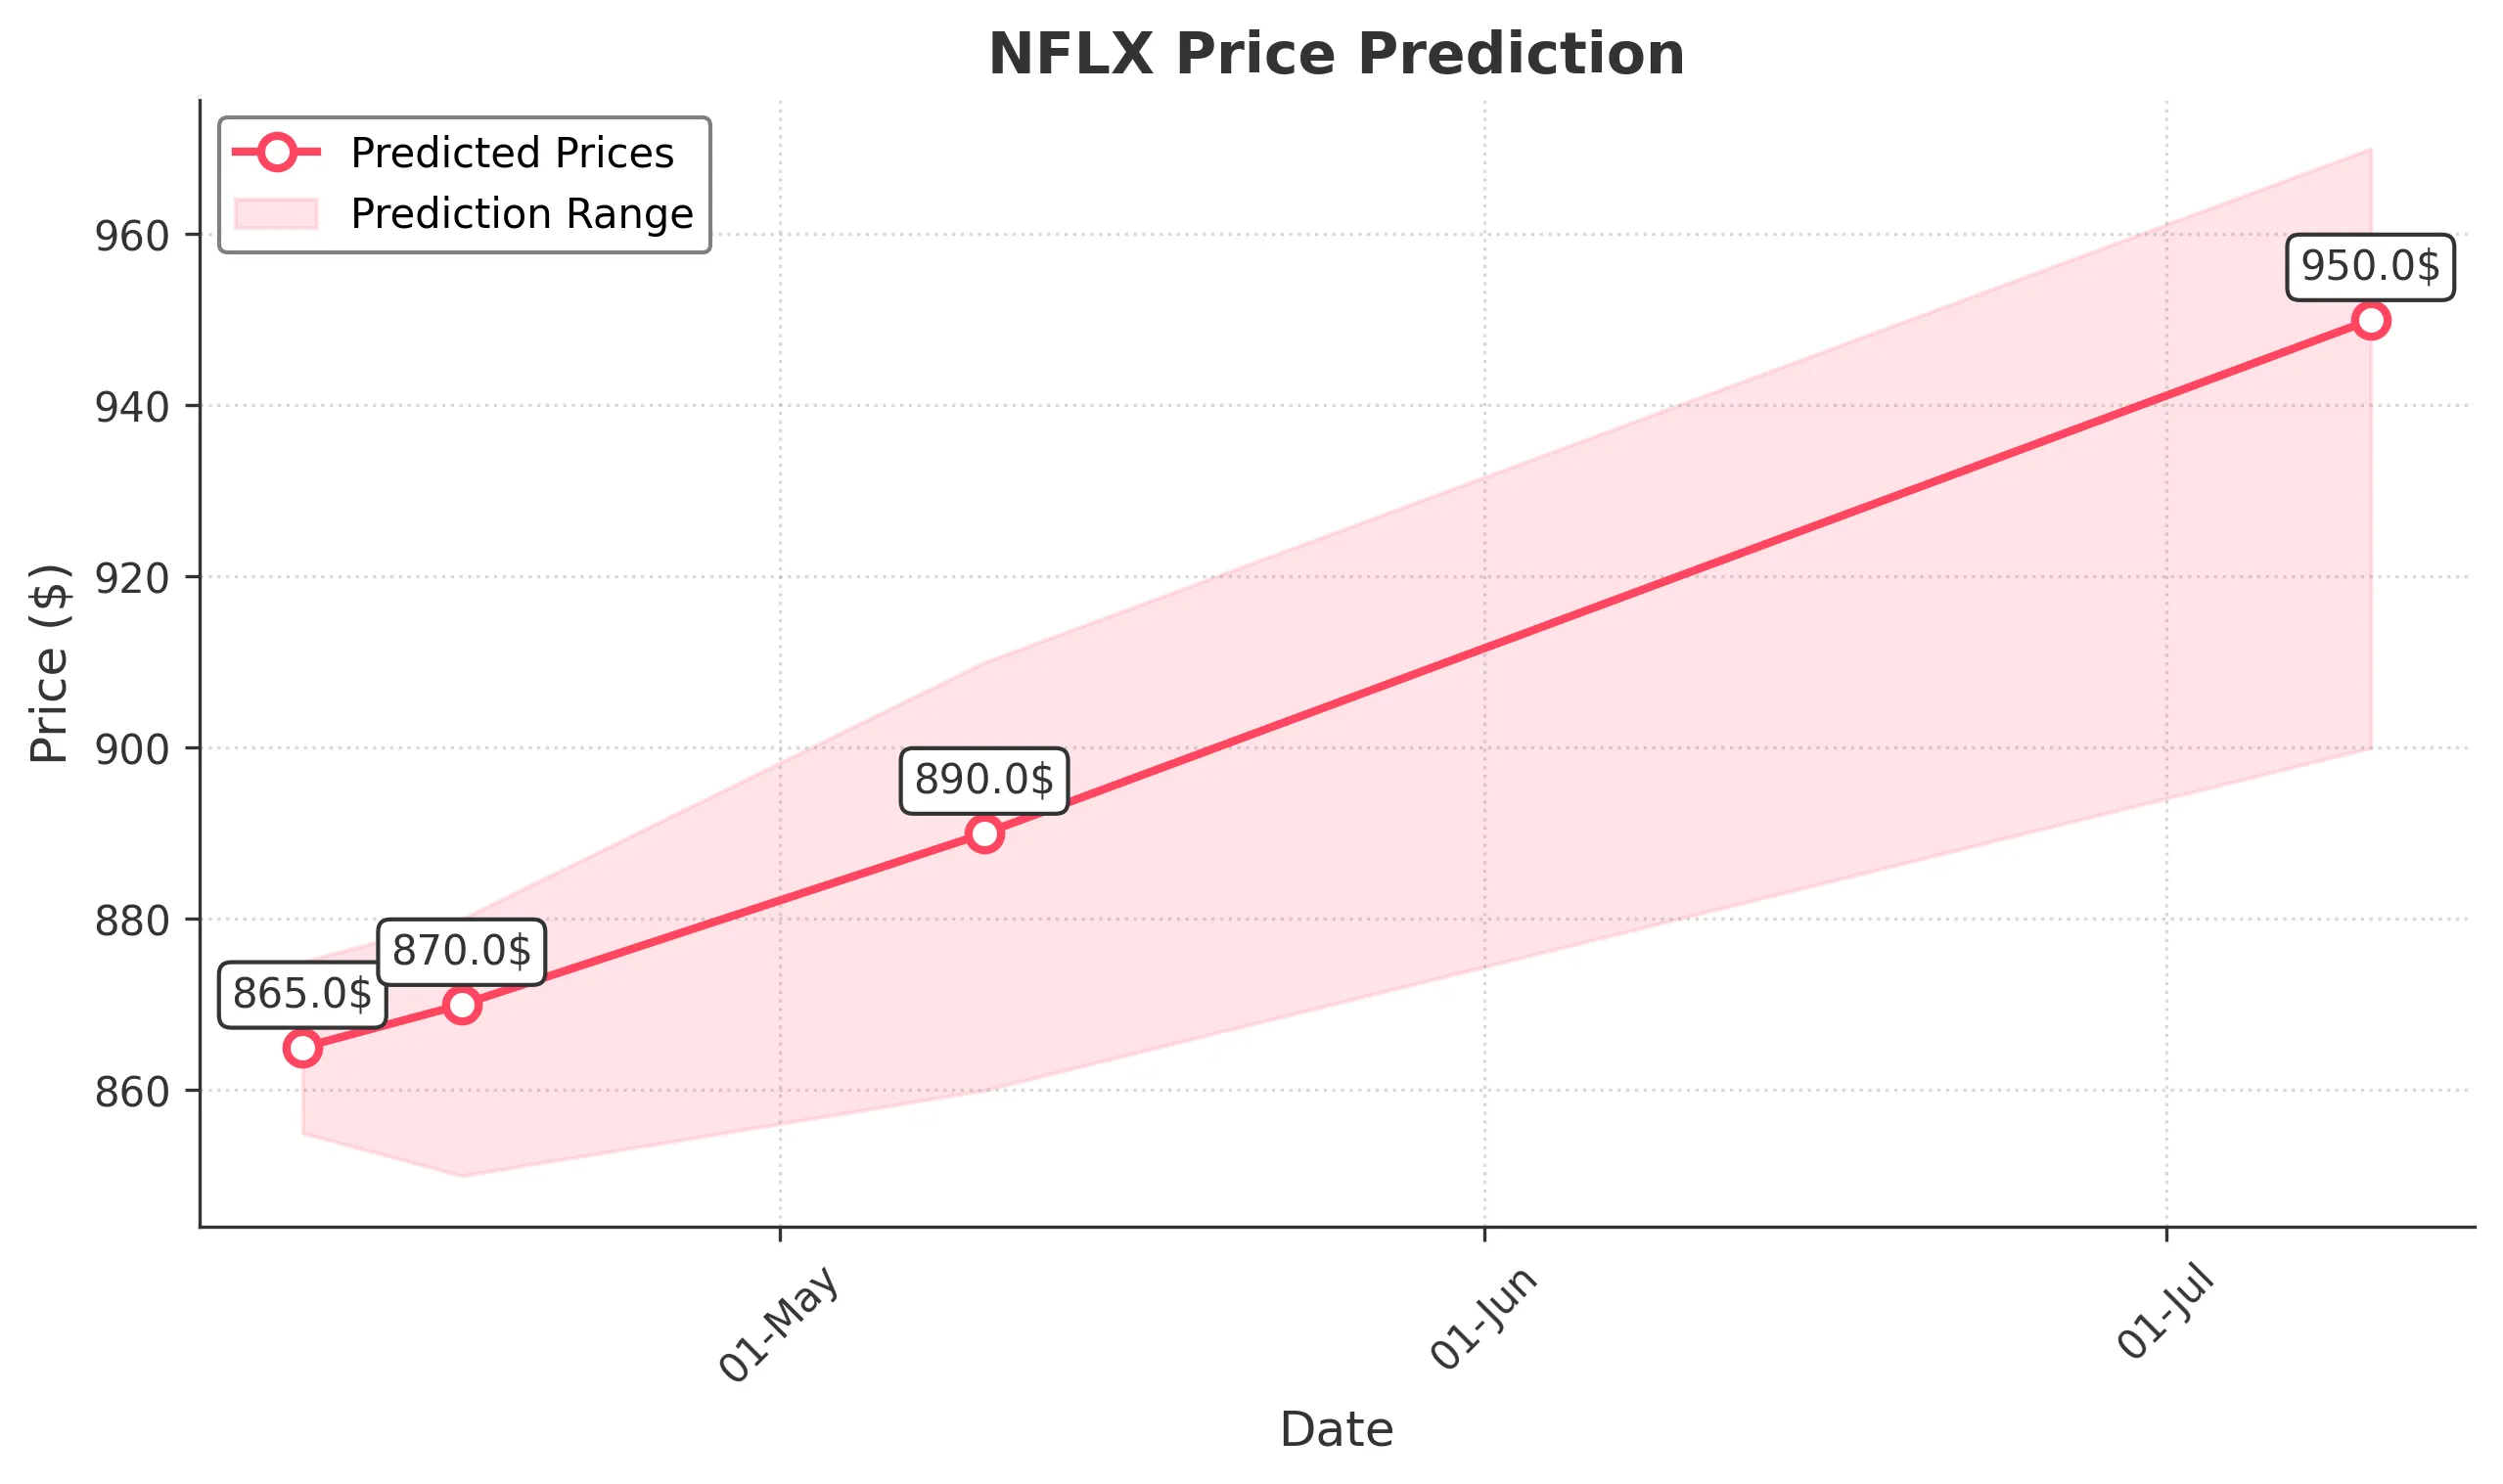
Target: April 10, 2025$865
$862
$875
$855
Description
The stock shows a slight bullish trend with a potential close around 865. The RSI indicates neutrality, while MACD suggests a possible upward momentum. However, recent volatility and market sentiment could lead to fluctuations.
Analysis
Over the past 3 months, NFLX has shown a bearish trend with significant fluctuations. Key support is around 855, while resistance is near 875. The recent volume spikes indicate increased interest, but the overall sentiment remains cautious.
Confidence Level
Potential Risks
Market volatility and external news could impact the price significantly.
1 Week Prediction
Target: April 17, 2025$870
$865
$880
$850
Description
Expect a close around 870 as the stock may recover slightly. The Bollinger Bands suggest a potential breakout, but the MACD indicates mixed signals. Watch for volume trends to confirm direction.
Analysis
The stock has been volatile, with key support at 850 and resistance at 880. The RSI is approaching oversold territory, indicating a possible bounce. However, external factors could lead to further declines.
Confidence Level
Potential Risks
Potential for reversal exists if market sentiment shifts negatively.
1 Month Prediction
Target: May 10, 2025$890
$870
$910
$860
Description
A potential close of 890 suggests a gradual recovery. The Fibonacci retracement levels indicate support at 860, while the MACD shows a bullish crossover. However, watch for any macroeconomic news that could impact sentiment.
Analysis
The stock has been in a bearish phase but shows signs of recovery. Key resistance is at 910, with support at 860. Volume patterns indicate increased buying interest, but caution is warranted due to market conditions.
Confidence Level
Potential Risks
Economic indicators and earnings reports could introduce volatility.
3 Months Prediction
Target: July 10, 2025$950
$925
$970
$900
Description
A close around 950 indicates a bullish outlook as the stock may recover further. The MACD and RSI suggest upward momentum, but external factors could still pose risks.
Analysis
The stock has shown a mixed performance with a potential bullish reversal. Key support is at 900, while resistance is at 970. The overall market sentiment is cautiously optimistic, but external factors could influence the trend.
Confidence Level
Potential Risks
Unforeseen market events or earnings surprises could lead to volatility.