NFLX Trading Predictions
1 Day Prediction
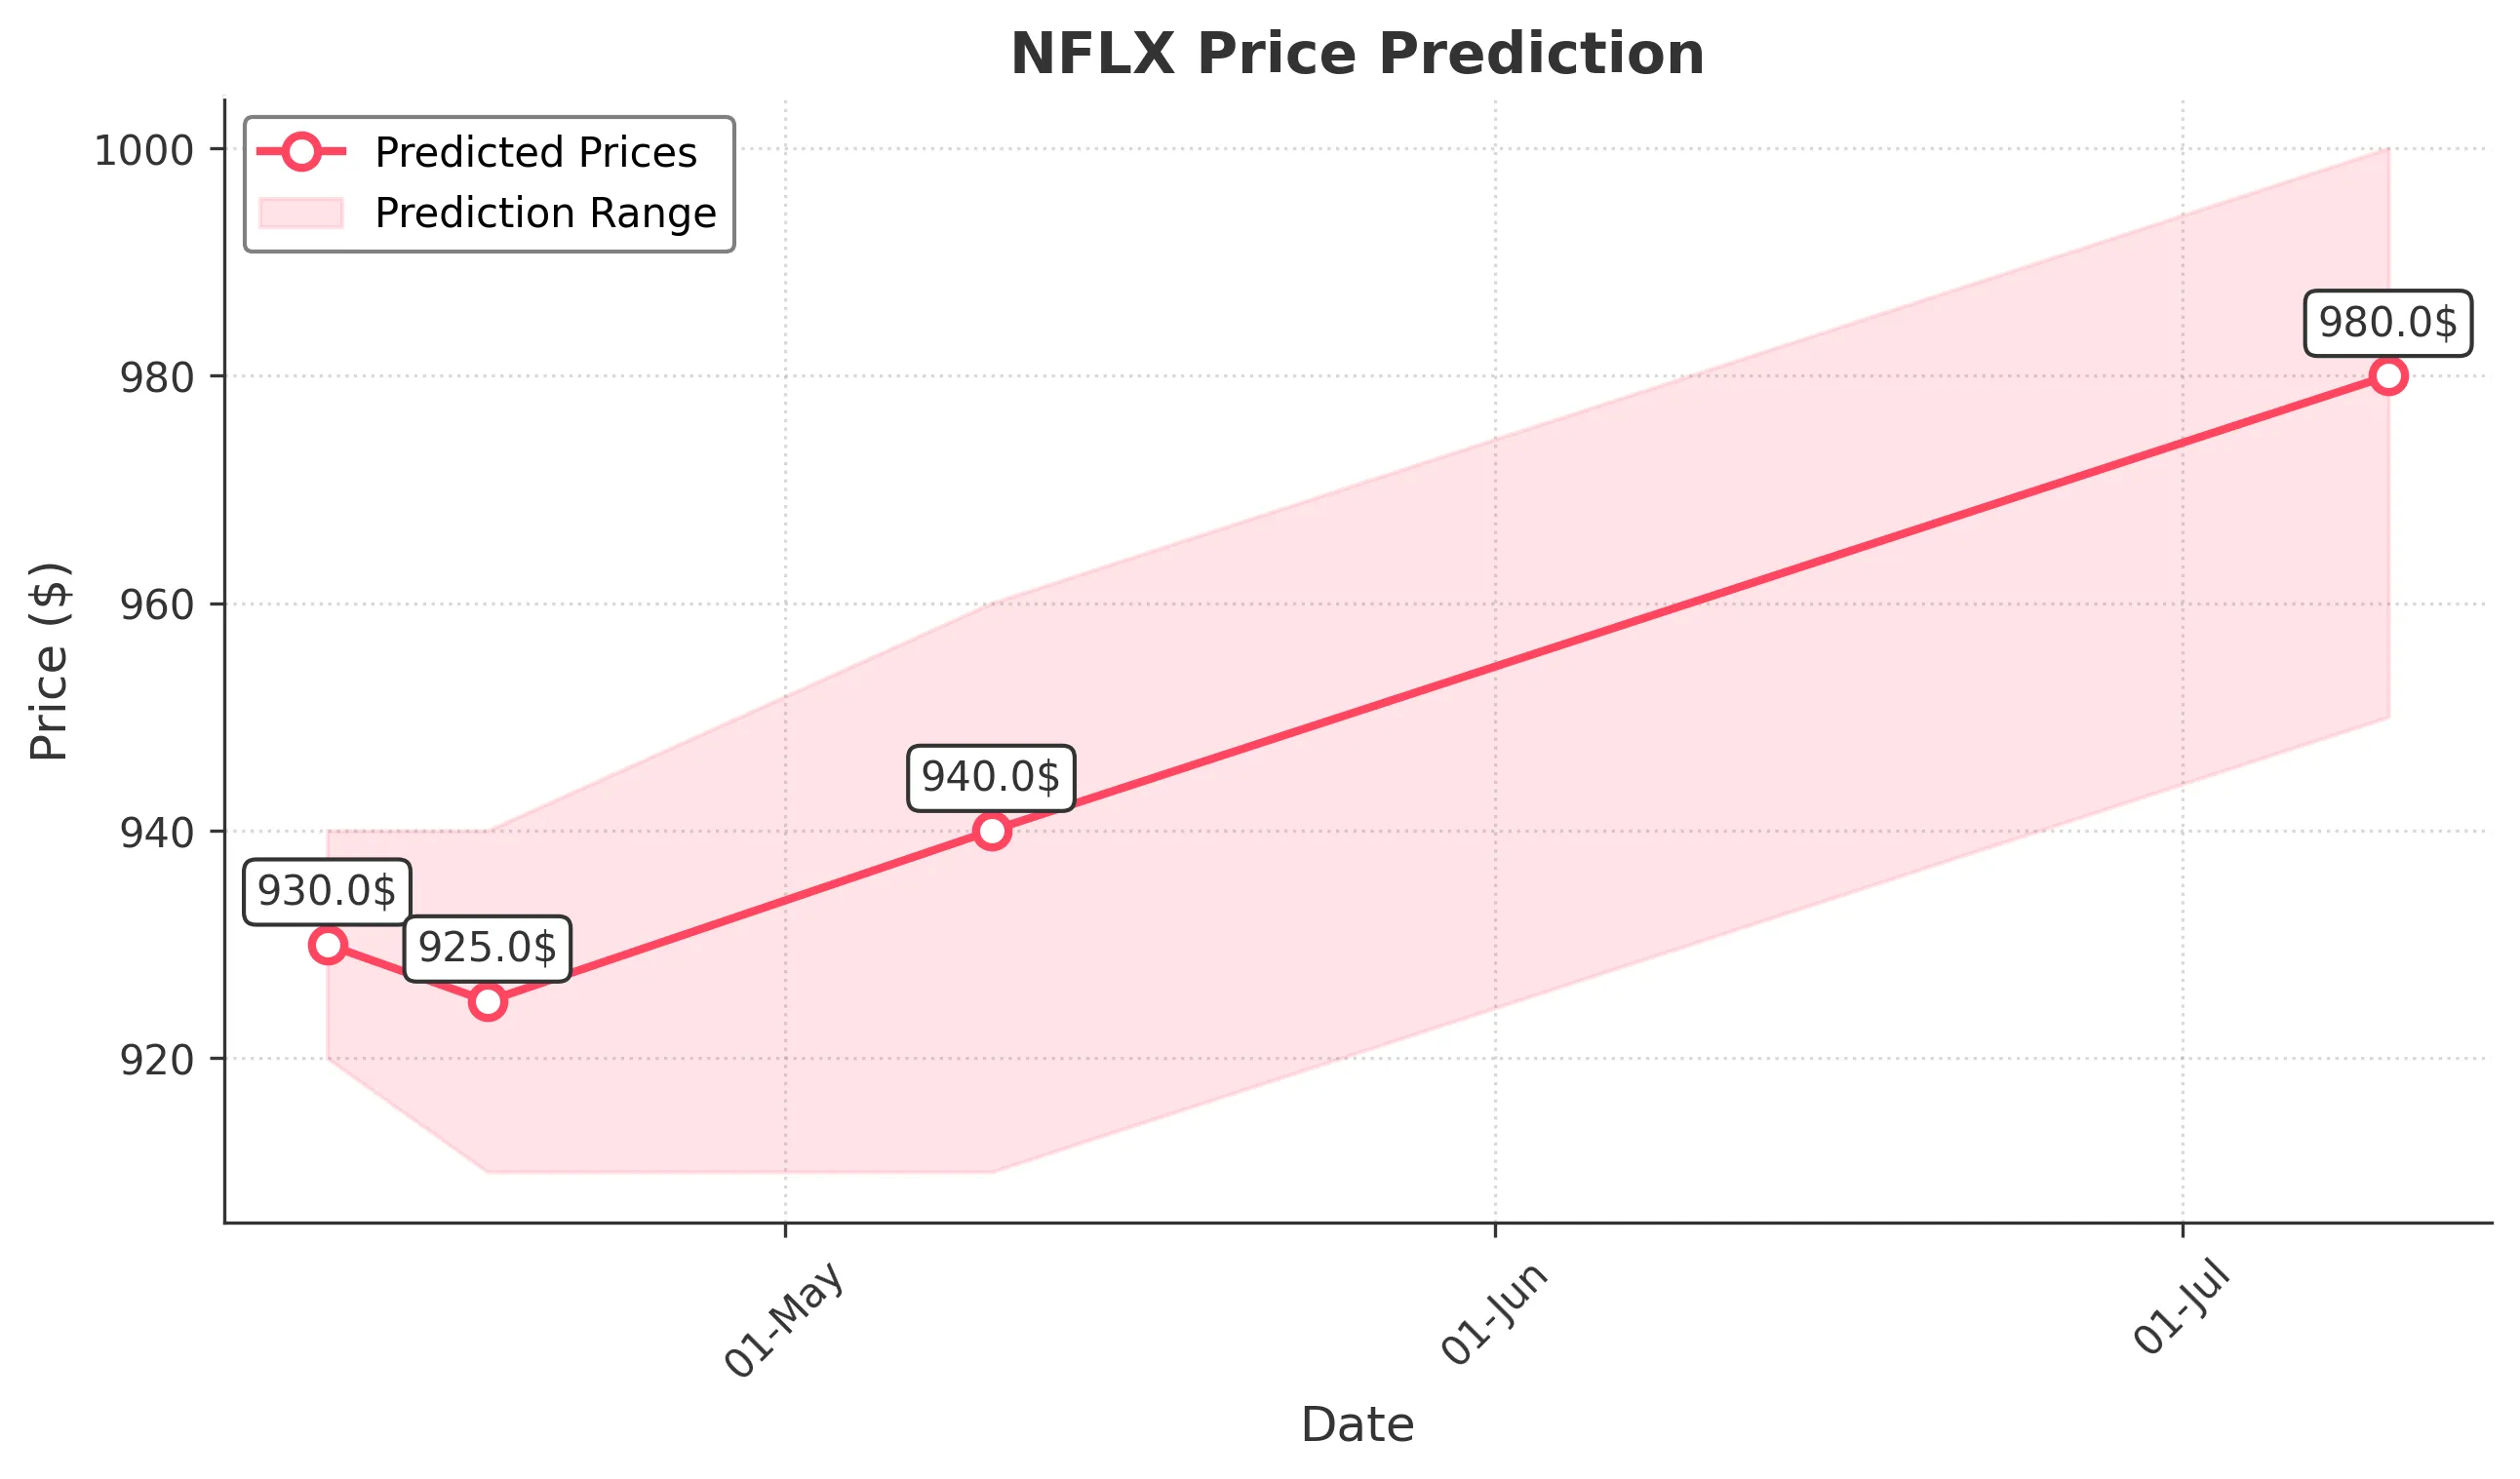
Target: April 11, 2025$930
$935
$940
$920
Description
The stock shows a slight bullish trend with a potential close around 930. The recent candlestick patterns indicate indecision, and the RSI is near neutral, suggesting a possible consolidation phase.
Analysis
Over the past 3 months, NFLX has shown a bearish trend with significant fluctuations. Key support is around 900, while resistance is near 950. The MACD indicates a potential reversal, but the RSI suggests caution. Volume has been inconsistent, indicating uncertainty.
Confidence Level
Potential Risks
Market volatility and external news could impact the price significantly.
1 Week Prediction
Target: April 18, 2025$925
$920
$940
$910
Description
Expect a close around 925 as the stock may continue to consolidate. The Bollinger Bands are tightening, indicating reduced volatility, while the MACD shows a potential bullish crossover.
Analysis
The stock has been in a bearish trend, with recent attempts to recover. Support at 900 is critical, while resistance at 950 remains strong. The ATR indicates increasing volatility, and recent volume spikes suggest potential interest from traders.
Confidence Level
Potential Risks
Unforeseen macroeconomic events could lead to sudden price movements.
1 Month Prediction
Target: May 10, 2025$940
$925
$960
$910
Description
A potential rise to 940 is expected as the stock may break resistance levels. The Fibonacci retracement levels suggest a bullish reversal, but caution is advised due to recent bearish patterns.
Analysis
NFLX has shown mixed signals over the past three months, with a bearish trend recently. Key support at 900 and resistance at 950 are pivotal. The RSI indicates potential overbought conditions, while volume patterns suggest indecision among investors.
Confidence Level
Potential Risks
Market sentiment and earnings reports could significantly affect the stock's trajectory.
3 Months Prediction
Target: July 10, 2025$980
$970
$1000
$950
Description
A gradual recovery to 980 is anticipated as the stock may stabilize. The MACD indicates a bullish trend, but external factors could lead to volatility.
Analysis
The stock has been volatile, with a bearish trend recently. Support at 900 and resistance at 1000 are critical levels. The ATR suggests increasing volatility, and the market sentiment remains cautious. External economic factors could heavily influence future performance.
Confidence Level
Potential Risks
Long-term predictions are uncertain due to potential market shifts and economic conditions.