NFLX Trading Predictions
1 Day Prediction
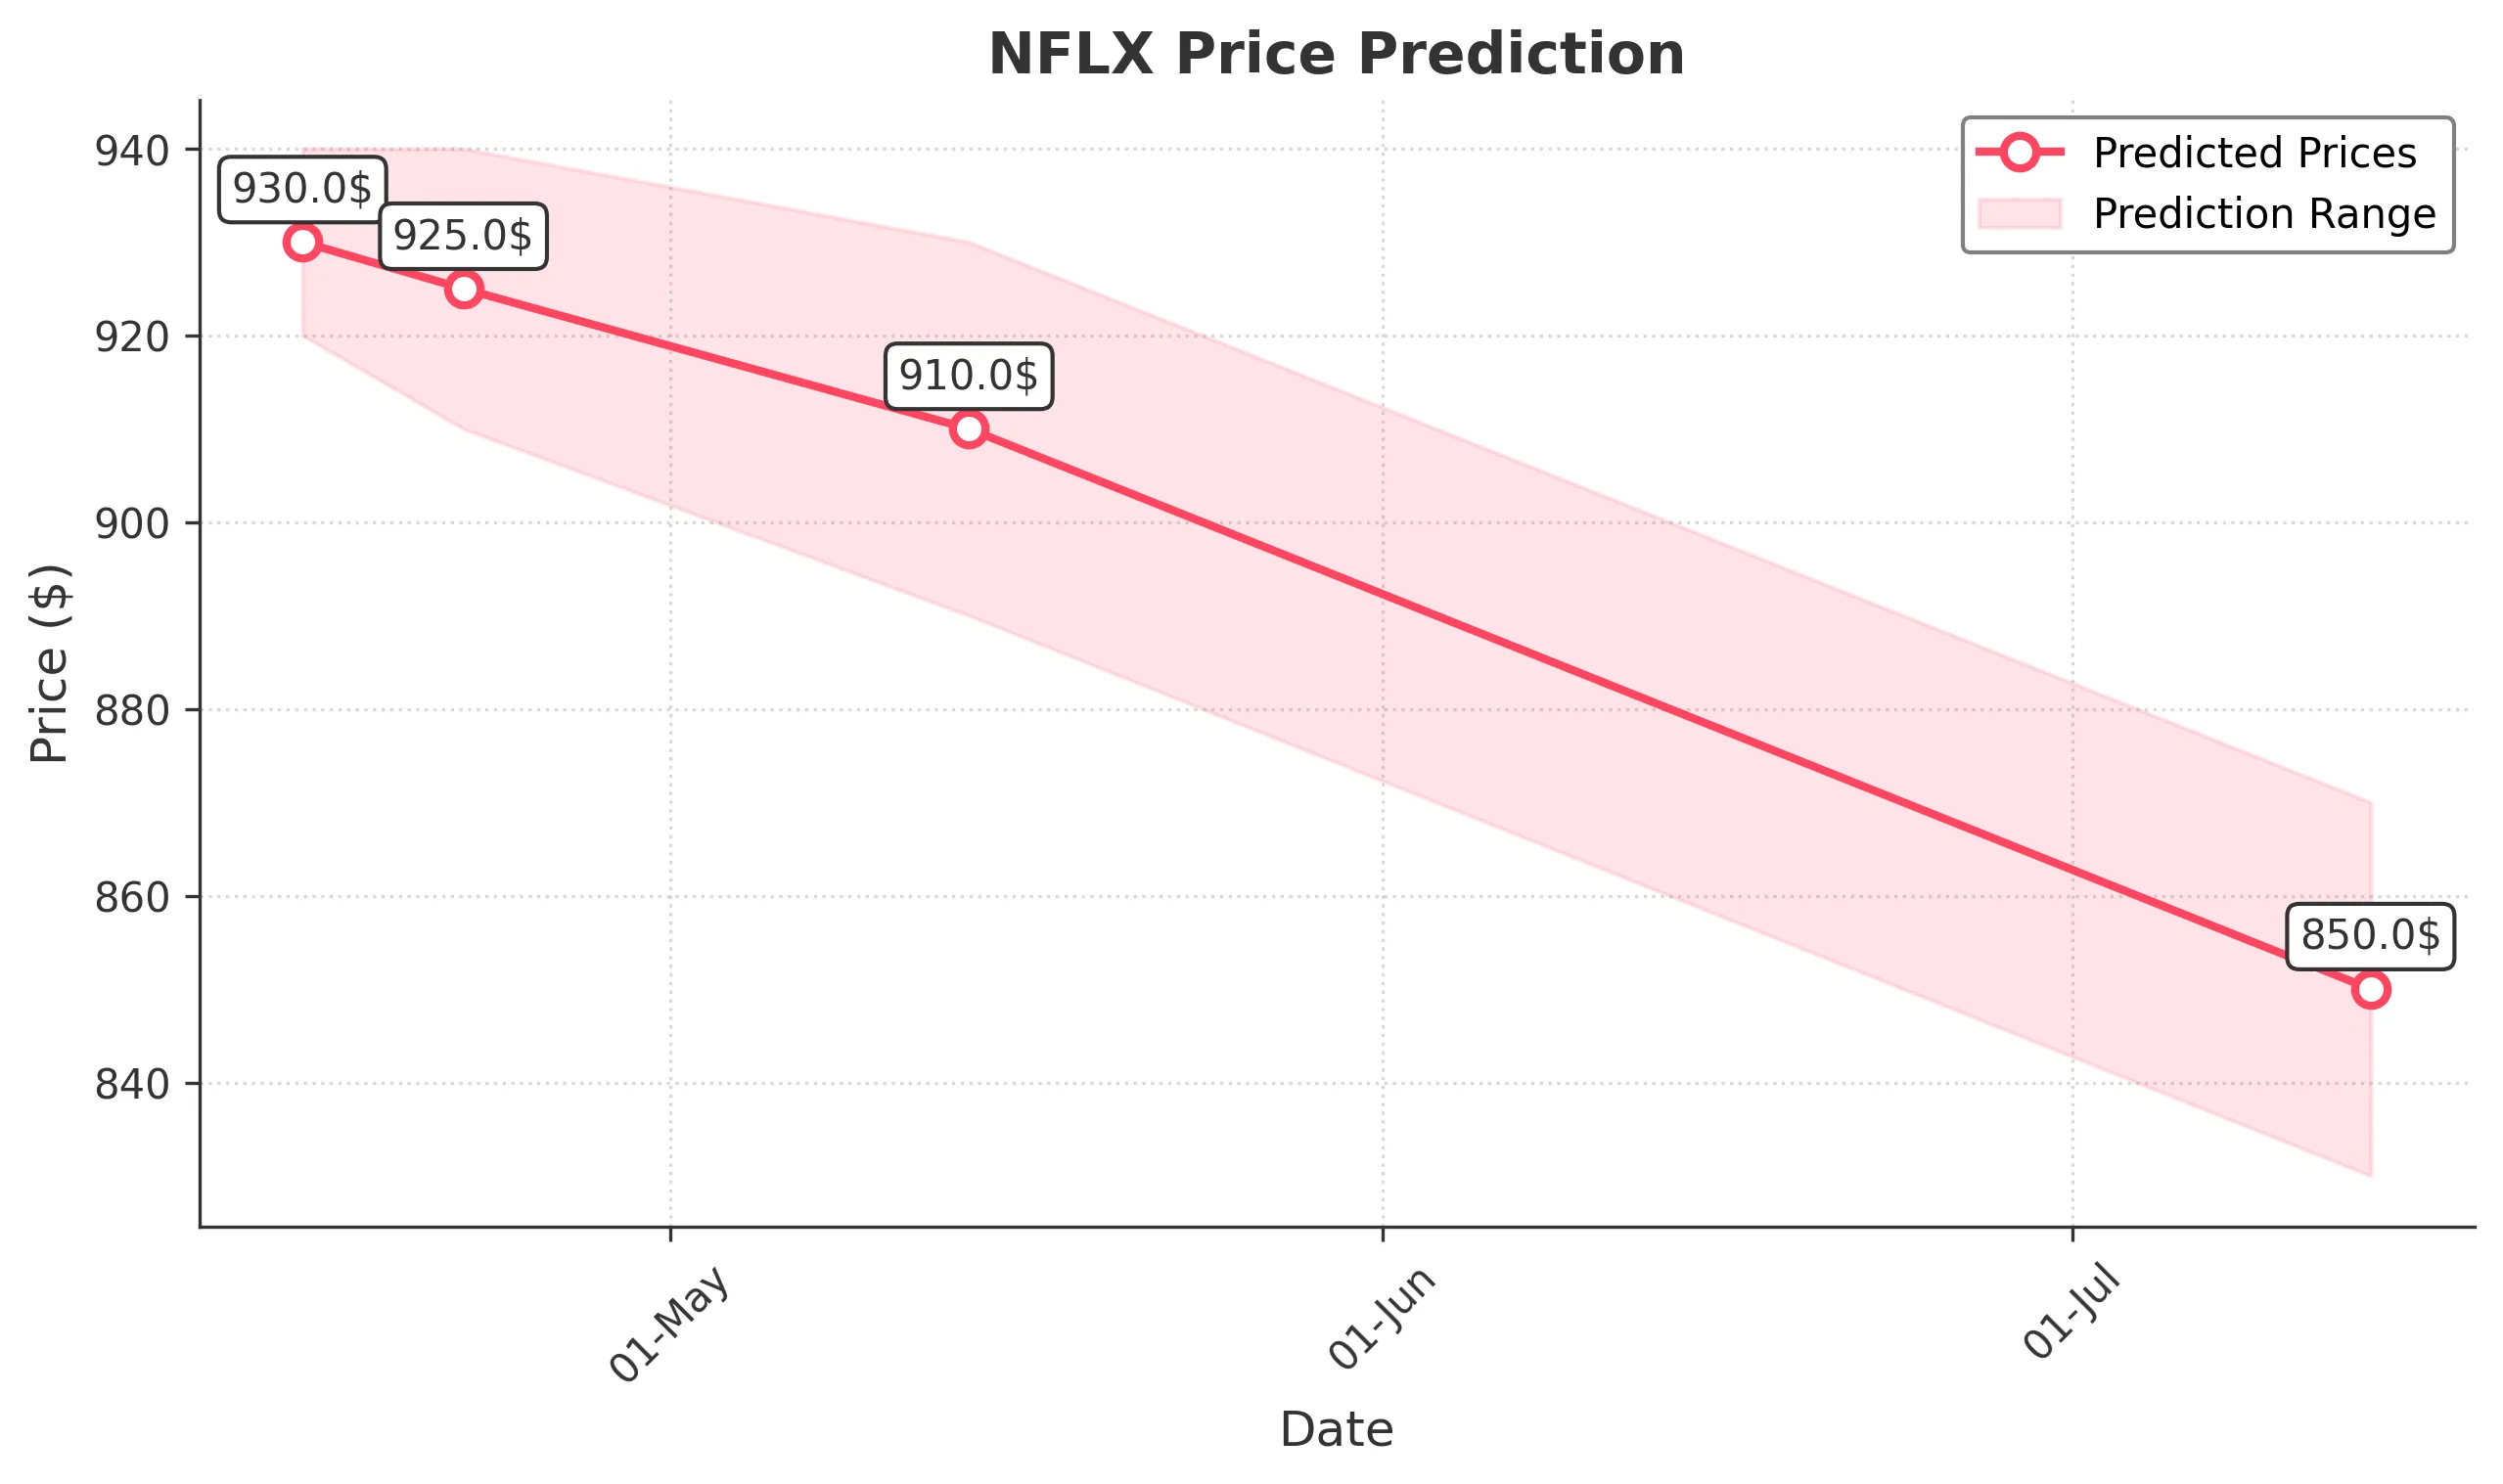
Target: April 15, 2025$930
$925
$940
$920
Description
The stock shows a slight bullish trend with a potential close around 930. The recent candlestick patterns indicate indecision, but the RSI is neutral, suggesting a possible consolidation before a breakout.
Analysis
Over the past 3 months, NFLX has shown a bearish trend with significant fluctuations. Key support is around 900, while resistance is near 950. The MACD indicates a potential reversal, but the RSI suggests caution.
Confidence Level
Potential Risks
Market volatility and external news could impact the price significantly.
1 Week Prediction
Target: April 22, 2025$925
$915
$940
$910
Description
Expecting a close around 925 as the stock may continue to consolidate. The Bollinger Bands are tightening, indicating reduced volatility, while the MACD shows a bearish crossover.
Analysis
The stock has been trading sideways with resistance at 950 and support at 900. Volume has been decreasing, indicating a lack of strong conviction in either direction. The ATR suggests low volatility.
Confidence Level
Potential Risks
Unforeseen macroeconomic events could lead to sudden price changes.
1 Month Prediction
Target: May 14, 2025$910
$920
$930
$890
Description
A bearish outlook with a predicted close of 910. The stock is likely to test lower support levels as the RSI indicates overbought conditions, and the MACD remains negative.
Analysis
NFLX has faced downward pressure, with significant resistance at 950. The recent price action suggests a bearish trend, and the volume spikes indicate potential sell-offs. The overall sentiment is cautious.
Confidence Level
Potential Risks
Market sentiment could shift rapidly based on earnings reports or economic data.
3 Months Prediction
Target: July 14, 2025$850
$860
$870
$830
Description
Long-term bearish trend expected with a close around 850. The stock may continue to decline as macroeconomic factors weigh heavily, and the technical indicators suggest further weakness.
Analysis
The stock has been in a bearish phase, with key support at 850. The MACD and RSI indicate continued weakness, and the overall market sentiment is bearish. Volume analysis shows increased selling pressure.
Confidence Level
Potential Risks
Potential for unexpected market rallies or positive news could alter this outlook.