NFLX Trading Predictions
1 Day Prediction
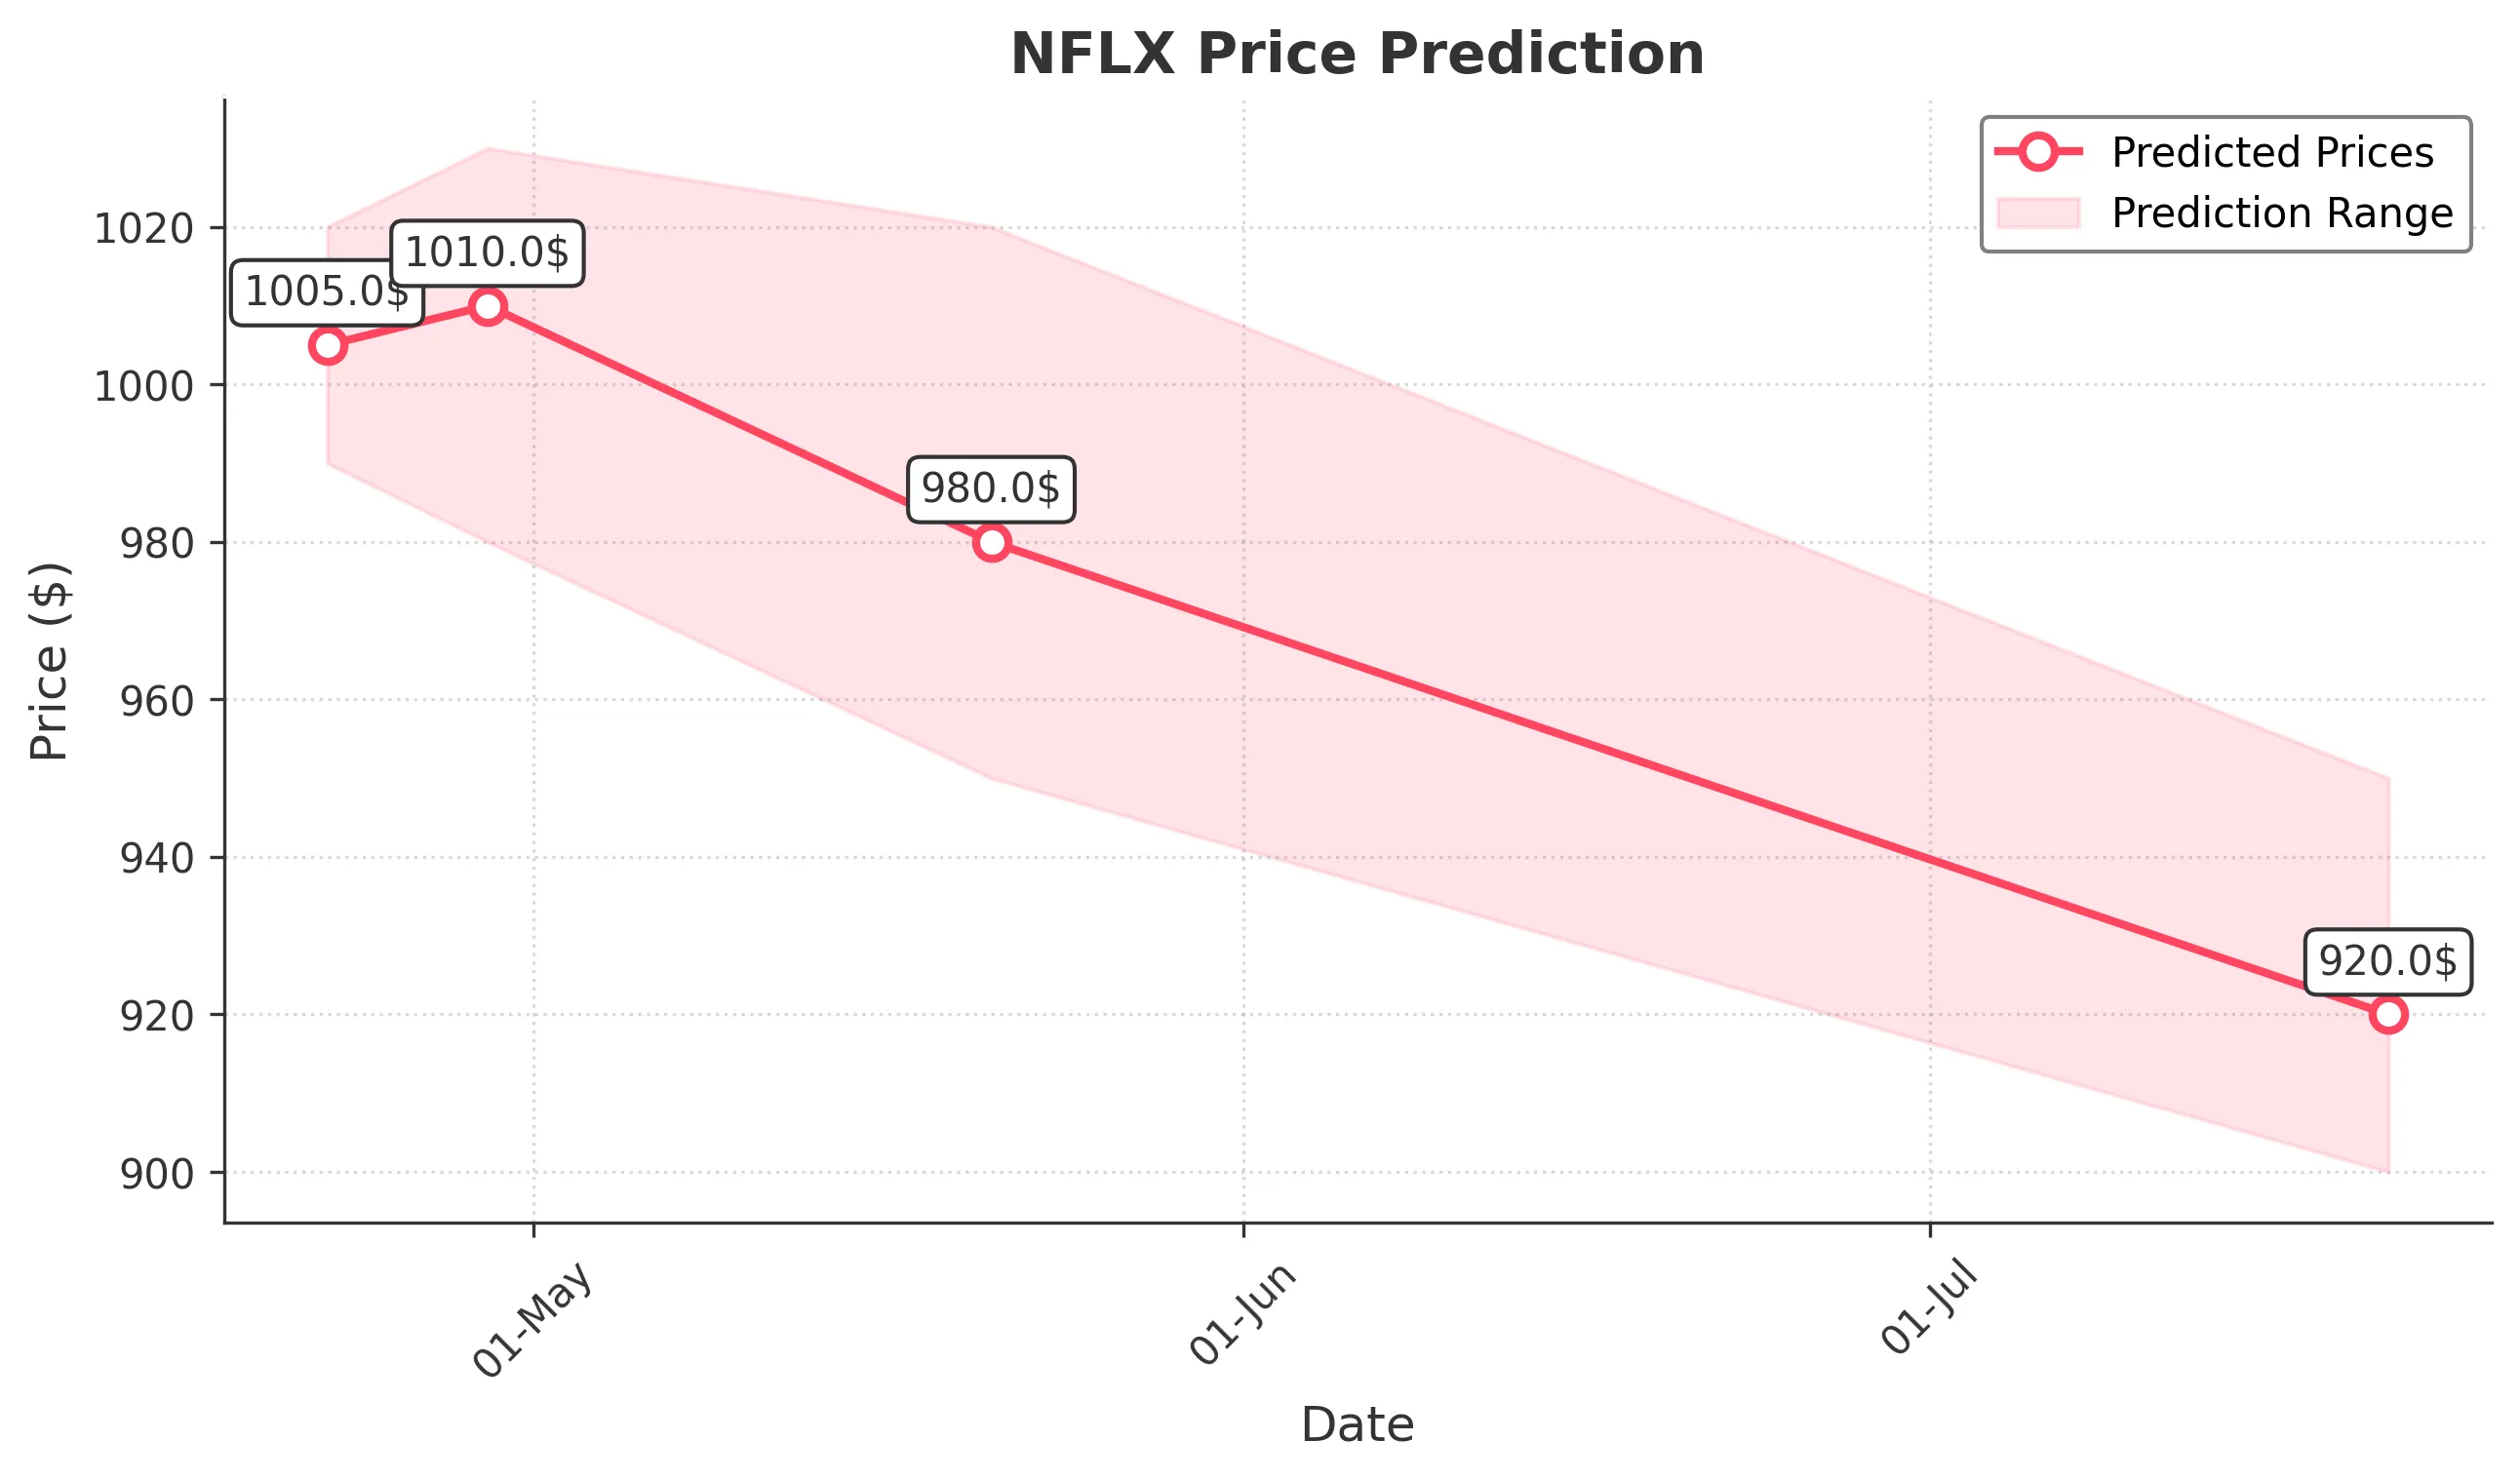
Target: April 22, 2025$1005
$1000
$1020
$990
Description
The stock shows bullish momentum with a recent close above key resistance at 1000. The RSI indicates overbought conditions, suggesting a potential pullback. However, strong volume and positive market sentiment may push the price higher.
Analysis
NFLX has shown a bullish trend over the past three months, with significant support at 950 and resistance at 1000. The recent price action indicates strong buying interest, but the RSI suggests caution due to overbought levels.
Confidence Level
Potential Risks
Potential for a pullback due to overbought RSI conditions and market volatility.
1 Week Prediction
Target: April 29, 2025$1010
$1005
$1030
$980
Description
The bullish trend is expected to continue, supported by strong earnings reports and positive market sentiment. However, the MACD shows signs of divergence, indicating potential weakness ahead.
Analysis
The stock has been trending upward, with key support at 950 and resistance at 1020. Volume spikes indicate strong buying interest, but the MACD divergence suggests caution for potential reversals.
Confidence Level
Potential Risks
Market sentiment could shift due to macroeconomic factors or earnings surprises.
1 Month Prediction
Target: May 21, 2025$980
$1000
$1020
$950
Description
Expect a correction as the stock approaches resistance levels. The Bollinger Bands indicate potential volatility, and the RSI suggests overbought conditions. A pullback to support levels is likely.
Analysis
NFLX has shown strong performance but is nearing resistance levels. The RSI indicates overbought conditions, and the Bollinger Bands suggest potential volatility. Key support at 950 will be crucial in the coming month.
Confidence Level
Potential Risks
Unforeseen market events or earnings could impact the stock's trajectory.
3 Months Prediction
Target: July 21, 2025$920
$930
$950
$900
Description
A bearish trend may develop as the stock faces resistance and market sentiment shifts. The MACD indicates potential weakness, and external economic factors could weigh on performance.
Analysis
Over the past three months, NFLX has experienced significant fluctuations. The stock is currently facing resistance at 950, and the MACD suggests potential weakness. External economic factors may influence future performance.
Confidence Level
Potential Risks
Market volatility and economic conditions could lead to unexpected price movements.