NFLX Trading Predictions
1 Day Prediction
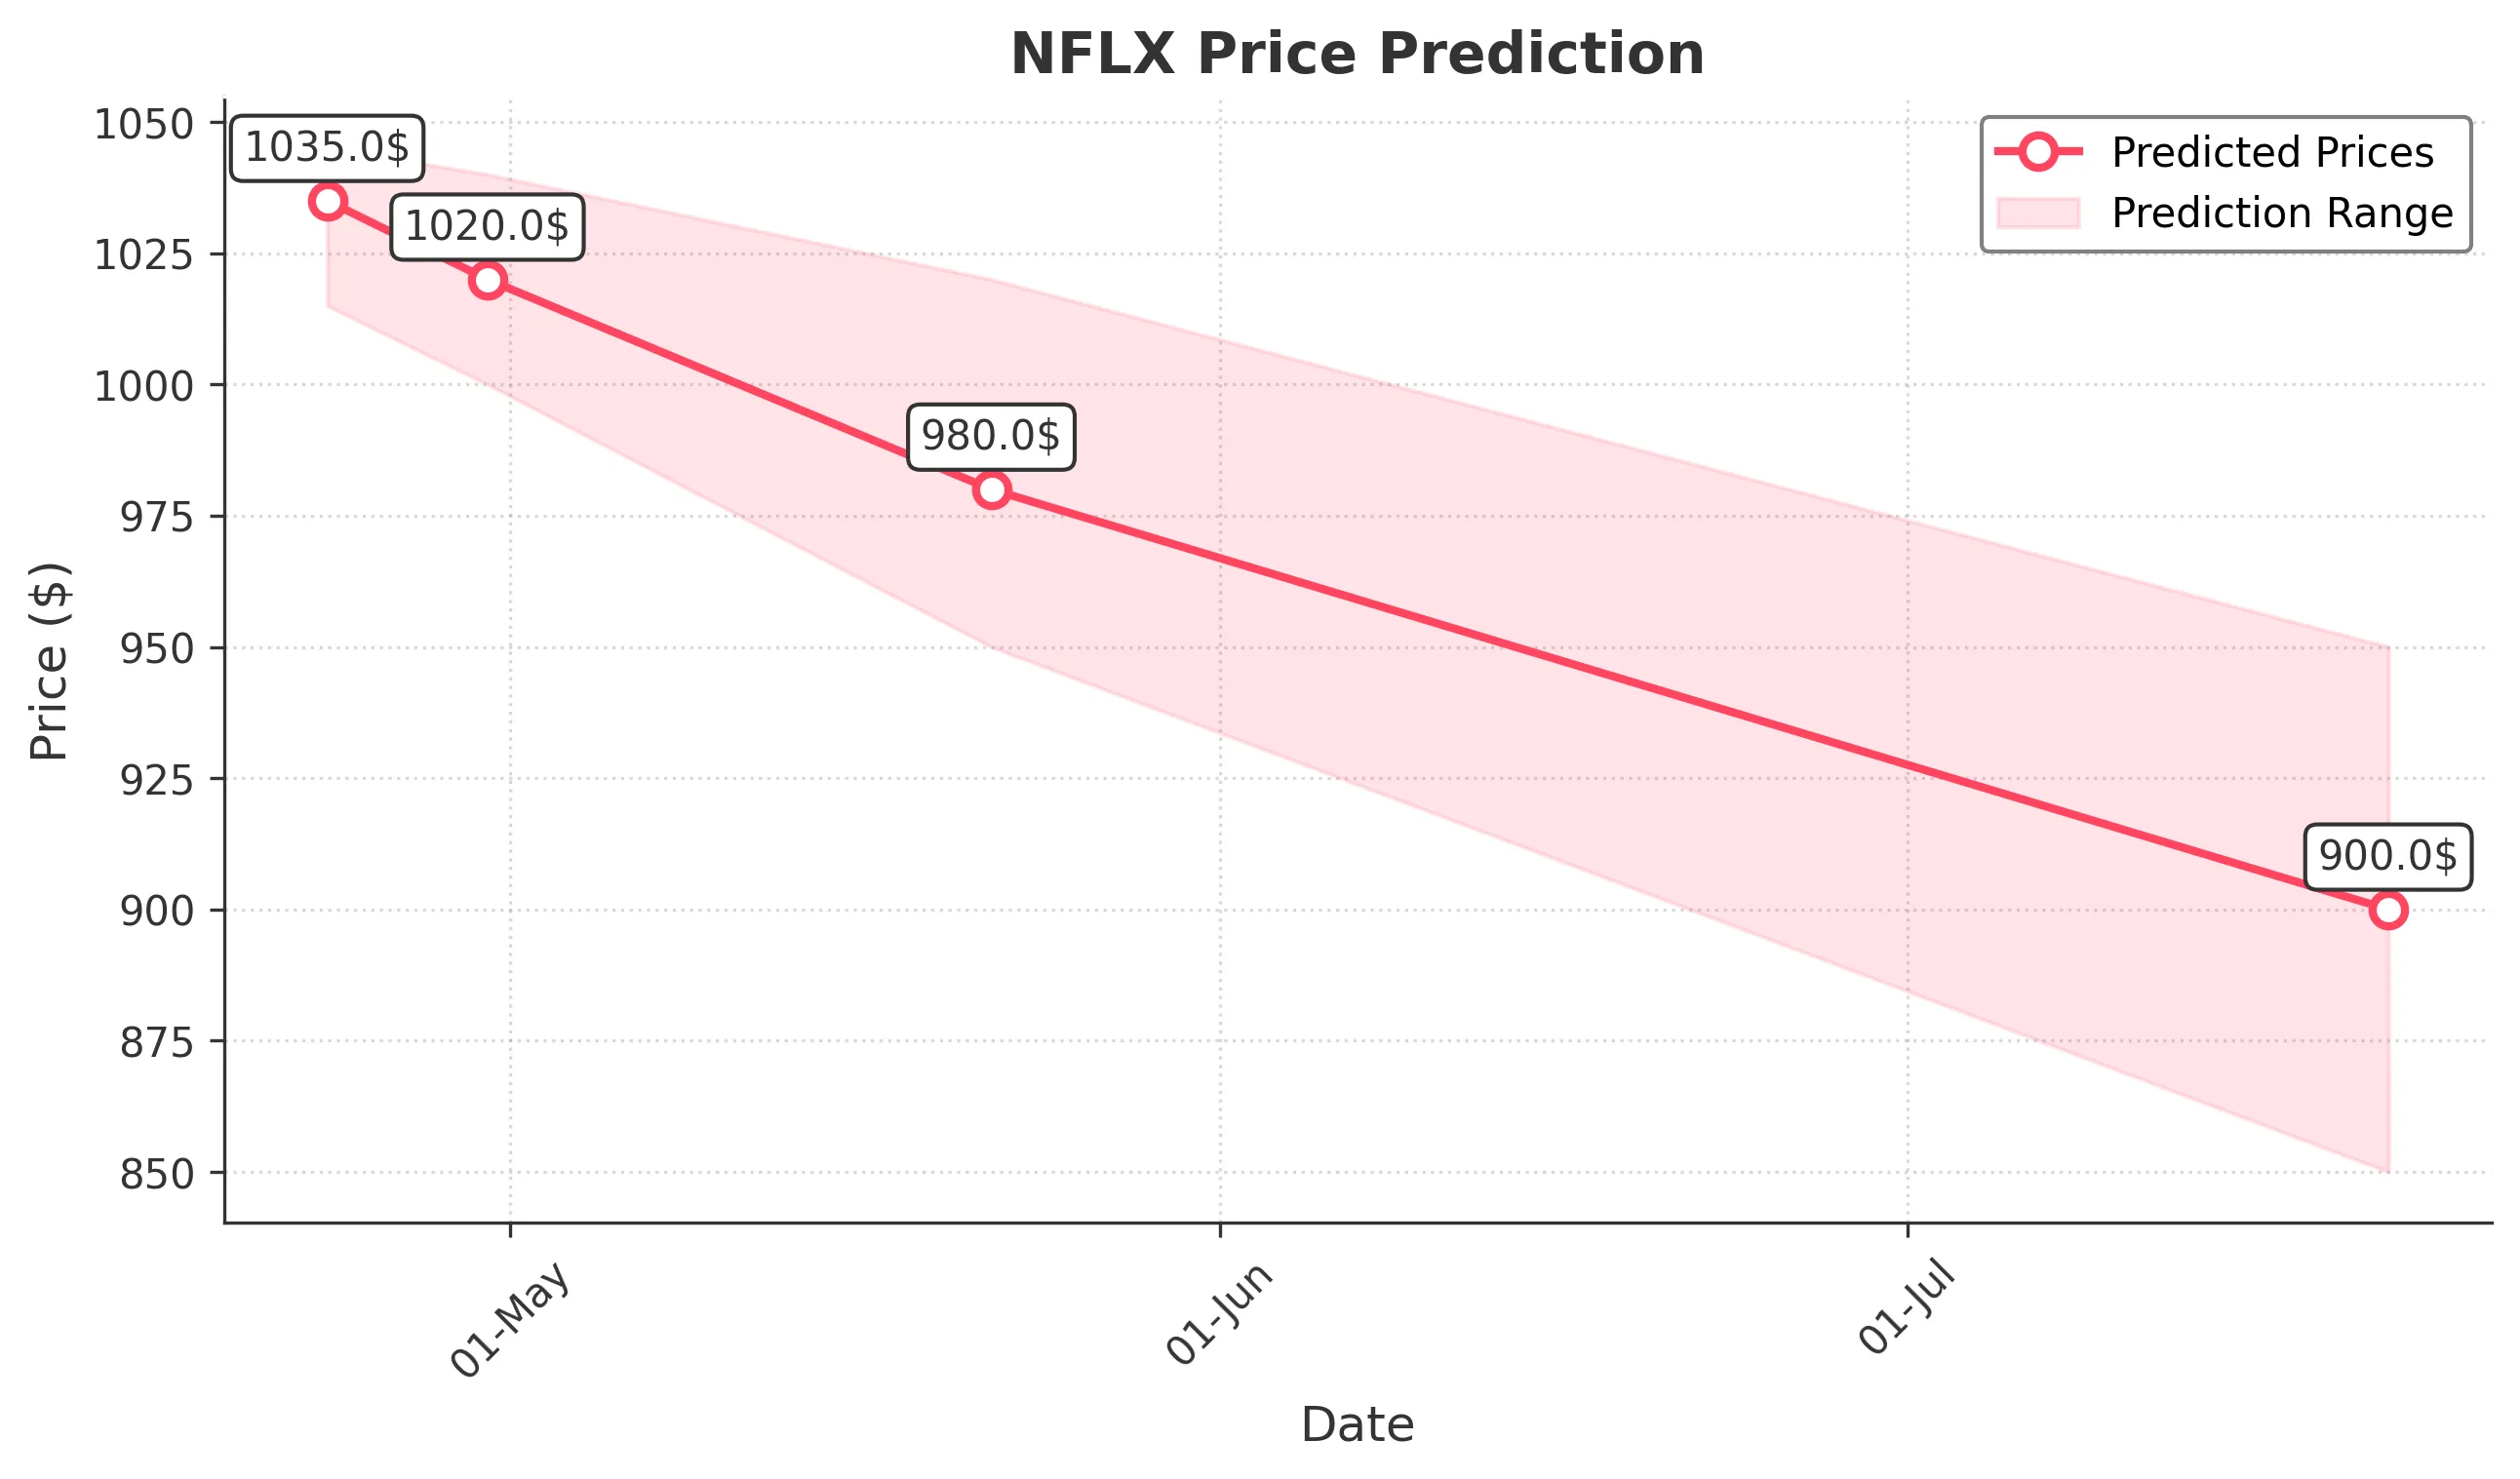
Target: April 23, 2025$1035
$1030
$1045
$1015
Description
The stock shows bullish momentum with a recent close above key resistance at 1030. The RSI is approaching overbought levels, indicating potential for a pullback. However, strong volume suggests continued interest. Watch for volatility.
Analysis
NFLX has shown a bullish trend over the past three months, with significant support at 950 and resistance at 1030. The recent price action indicates strong buying interest, but the RSI nearing overbought levels suggests caution. Volume has been robust, indicating strong market participation.
Confidence Level
Potential Risks
Potential for a pullback if RSI exceeds overbought levels. Market sentiment may shift due to external factors.
1 Week Prediction
Target: April 30, 2025$1020
$1035
$1040
$1000
Description
Expect a slight pullback as the stock approaches resistance levels. The MACD shows signs of divergence, indicating potential weakening momentum. Volume may decrease as traders take profits.
Analysis
The stock has been in a bullish phase, but recent candlestick patterns suggest a potential reversal. Key support at 1000 may hold, but if broken, further declines could occur. The MACD indicates weakening momentum, warranting caution.
Confidence Level
Potential Risks
Market volatility and profit-taking could lead to unexpected price movements.
1 Month Prediction
Target: May 22, 2025$980
$1020
$1020
$950
Description
A bearish trend may develop as the stock faces resistance. The Bollinger Bands indicate potential for a squeeze, suggesting volatility ahead. Watch for support at 950.
Analysis
The stock has shown volatility with a recent high of 1030. However, bearish signals from the MACD and RSI suggest a potential downturn. Key support at 950 is critical; a break below could lead to further declines.
Confidence Level
Potential Risks
Unforeseen macroeconomic events could impact market sentiment significantly.
3 Months Prediction
Target: July 22, 2025$900
$920
$950
$850
Description
Long-term bearish sentiment may prevail as macroeconomic factors weigh on the stock. The Fibonacci retracement levels suggest a potential decline towards 850.
Analysis
Over the past three months, NFLX has experienced significant volatility. The stock is currently facing resistance at 1030, and bearish patterns suggest a potential decline. Key support at 850 is critical; a breach could lead to further losses.
Confidence Level
Potential Risks
Market conditions and external economic factors could lead to unexpected price movements.