NFLX Trading Predictions
1 Day Prediction
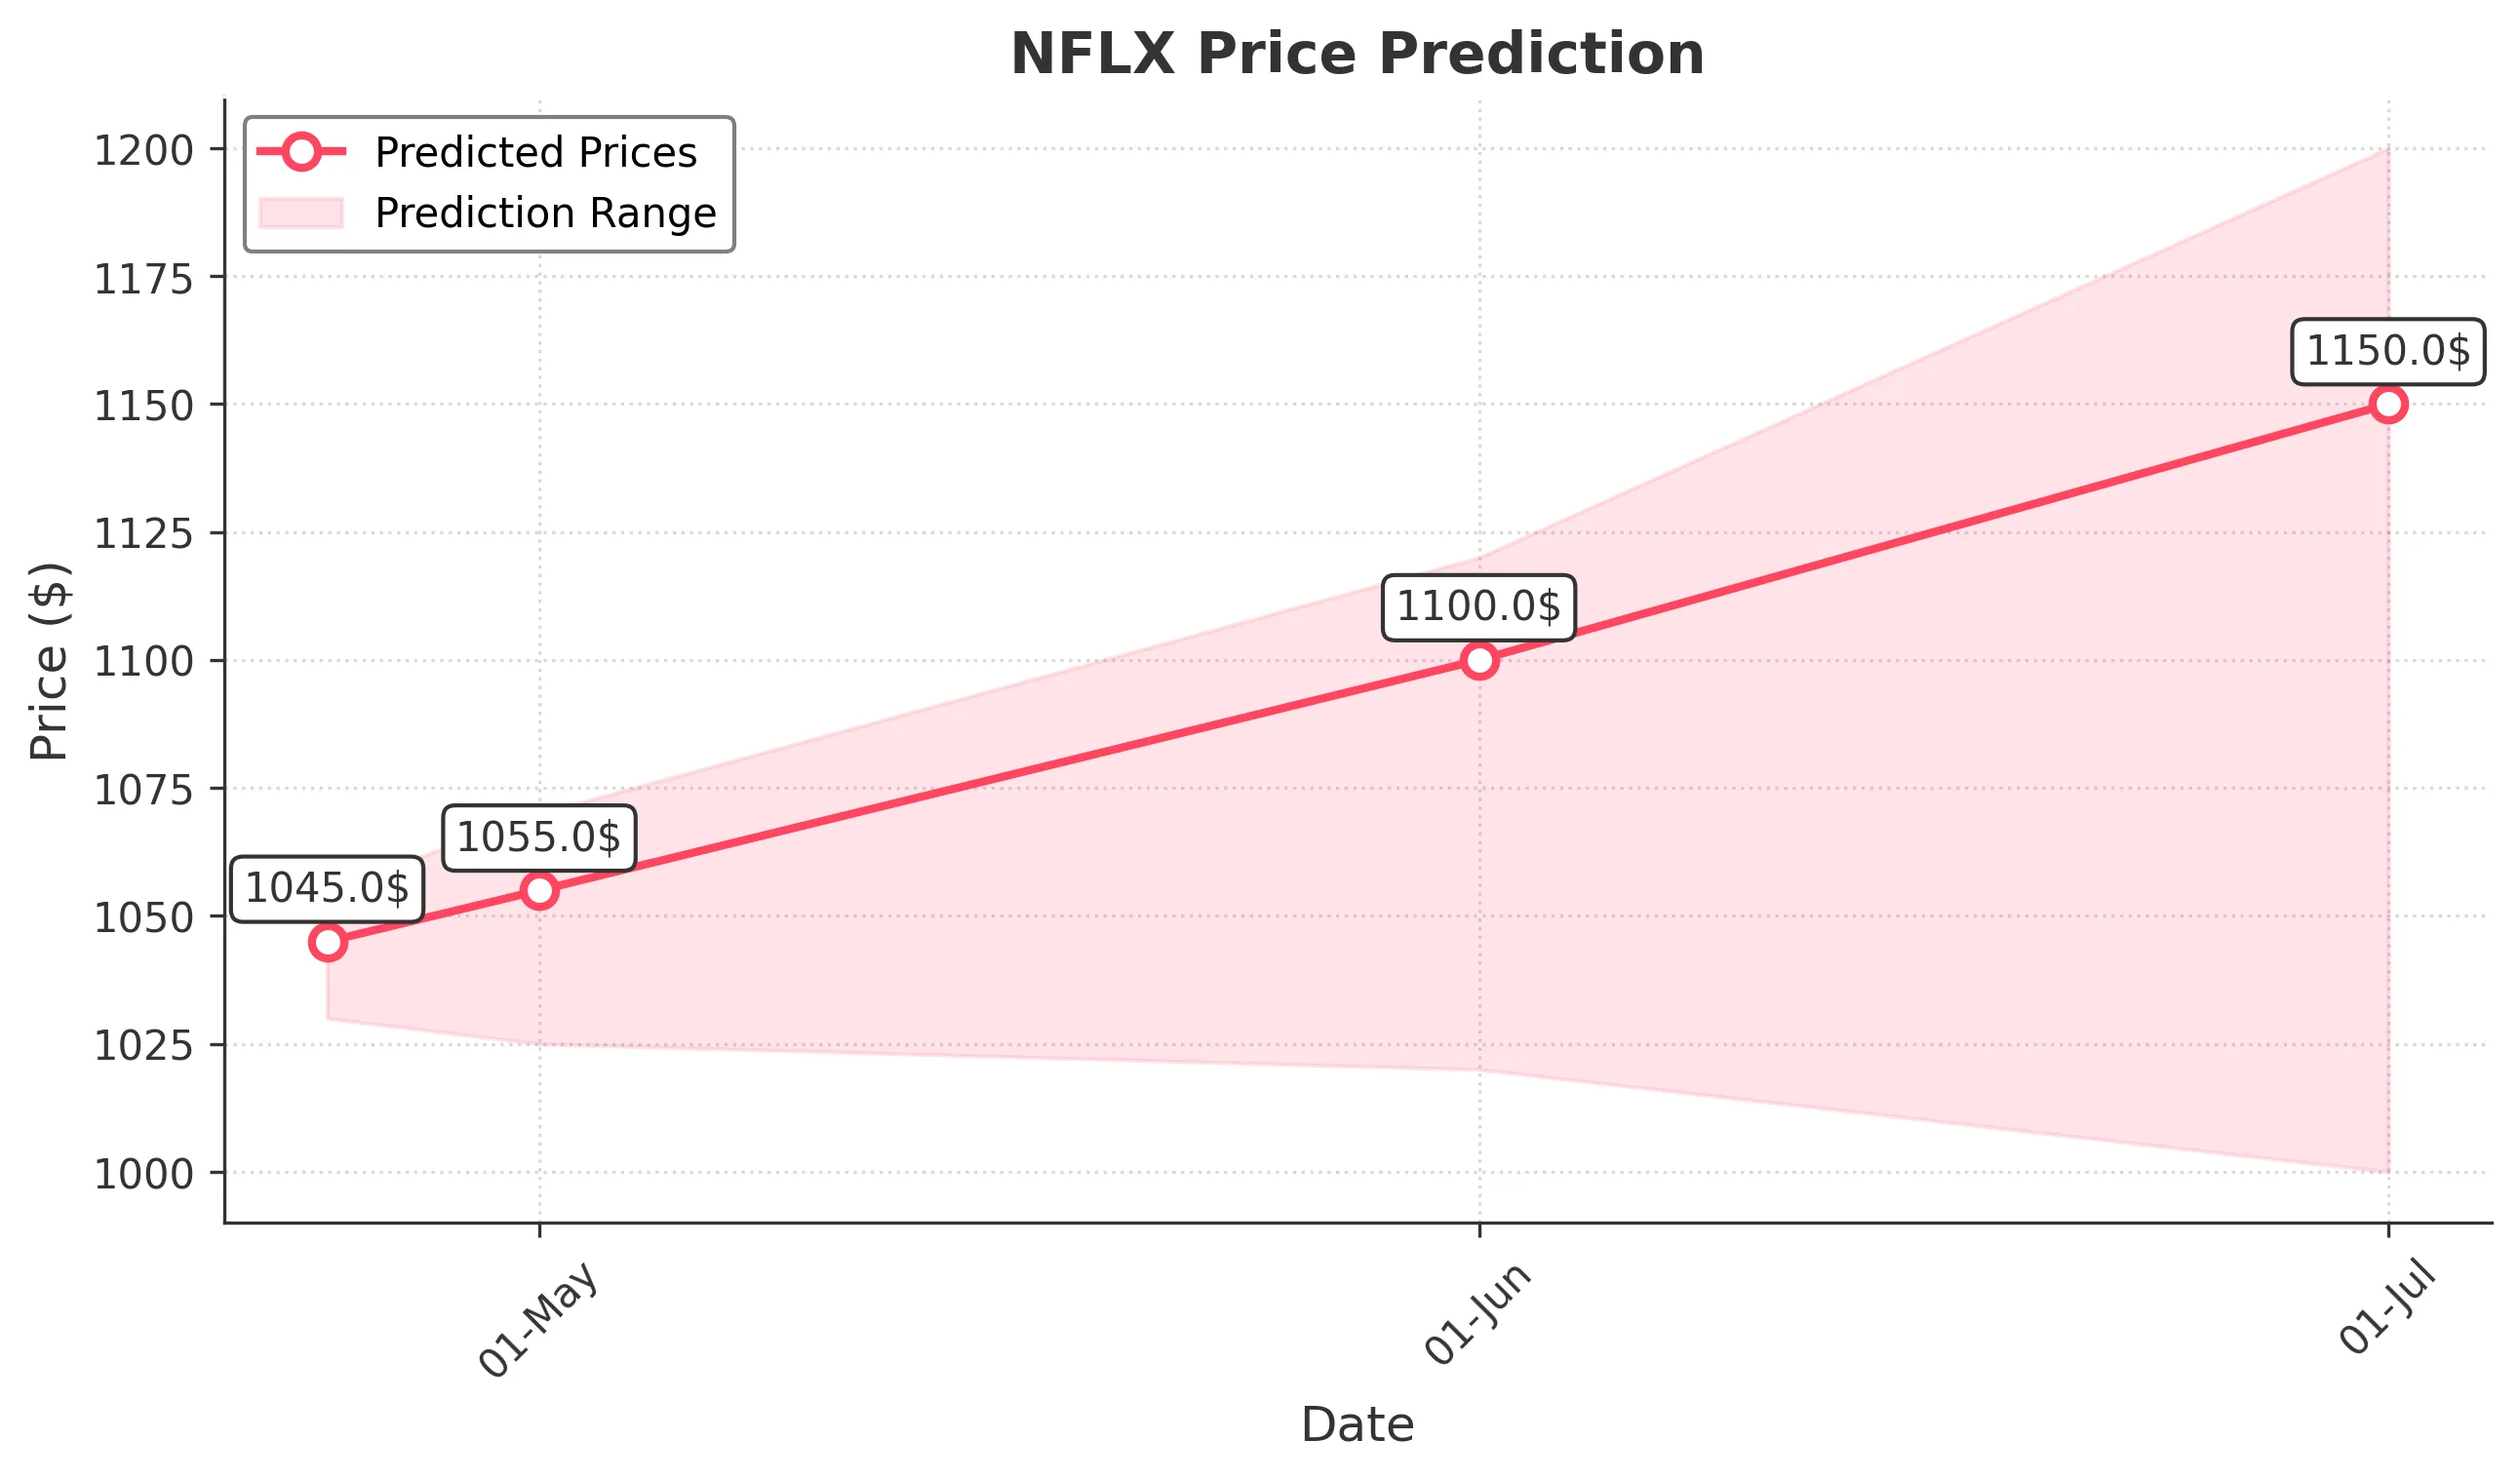
Target: April 24, 2025$1045
$1040
$1055
$1030
Description
The stock shows bullish momentum with a recent close above key resistance at 1040. The RSI is approaching overbought levels, indicating potential for a pullback. However, strong volume suggests continued interest. Expect a slight upward movement.
Analysis
NFLX has shown a bullish trend over the past three months, with significant support at 1000 and resistance around 1040. The recent price action indicates strong buying interest, but the RSI nearing overbought levels suggests caution. Volume has been robust, indicating strong market participation.
Confidence Level
Potential Risks
Potential profit-taking could lead to volatility. Watch for any negative news that may impact sentiment.
1 Week Prediction
Target: May 1, 2025$1055
$1045
$1070
$1025
Description
The upward trend is expected to continue, supported by strong volume and bullish candlestick patterns. However, the RSI indicates overbought conditions, which may lead to a pullback. Watch for any market sentiment shifts.
Analysis
The stock has been in a bullish phase, with key support at 1000 and resistance at 1040. The recent price action shows strong buying momentum, but the RSI suggests caution. Volume patterns indicate healthy trading activity, but external factors could introduce volatility.
Confidence Level
Potential Risks
Market volatility and external economic factors could impact the stock's performance. A reversal pattern could emerge if selling pressure increases.
1 Month Prediction
Target: June 1, 2025$1100
$1055
$1120
$1020
Description
Expect continued bullish momentum as the stock breaks through resistance levels. The MACD is showing a bullish crossover, and volume remains strong. However, overbought conditions may lead to short-term corrections.
Analysis
NFLX has maintained a bullish trend, with significant support at 1000 and resistance at 1040. The MACD indicates bullish momentum, but the RSI suggests caution. Volume patterns are strong, but external economic factors could introduce volatility.
Confidence Level
Potential Risks
Potential market corrections and economic news could impact the stock's trajectory. Watch for any bearish signals in the coming weeks.
3 Months Prediction
Target: July 1, 2025$1150
$1100
$1200
$1000
Description
Long-term bullish outlook as the stock is expected to break through key resistance levels. The overall market sentiment is positive, but watch for potential corrections due to overbought conditions.
Analysis
The stock has shown a strong bullish trend, with key support at 1000 and resistance at 1040. The MACD indicates bullish momentum, but the RSI suggests caution. Volume patterns are strong, but external economic factors could introduce volatility.
Confidence Level
Potential Risks
Market volatility and economic uncertainties could lead to unexpected price movements. A bearish reversal pattern could emerge if selling pressure increases.