NFLX Trading Predictions
1 Day Prediction
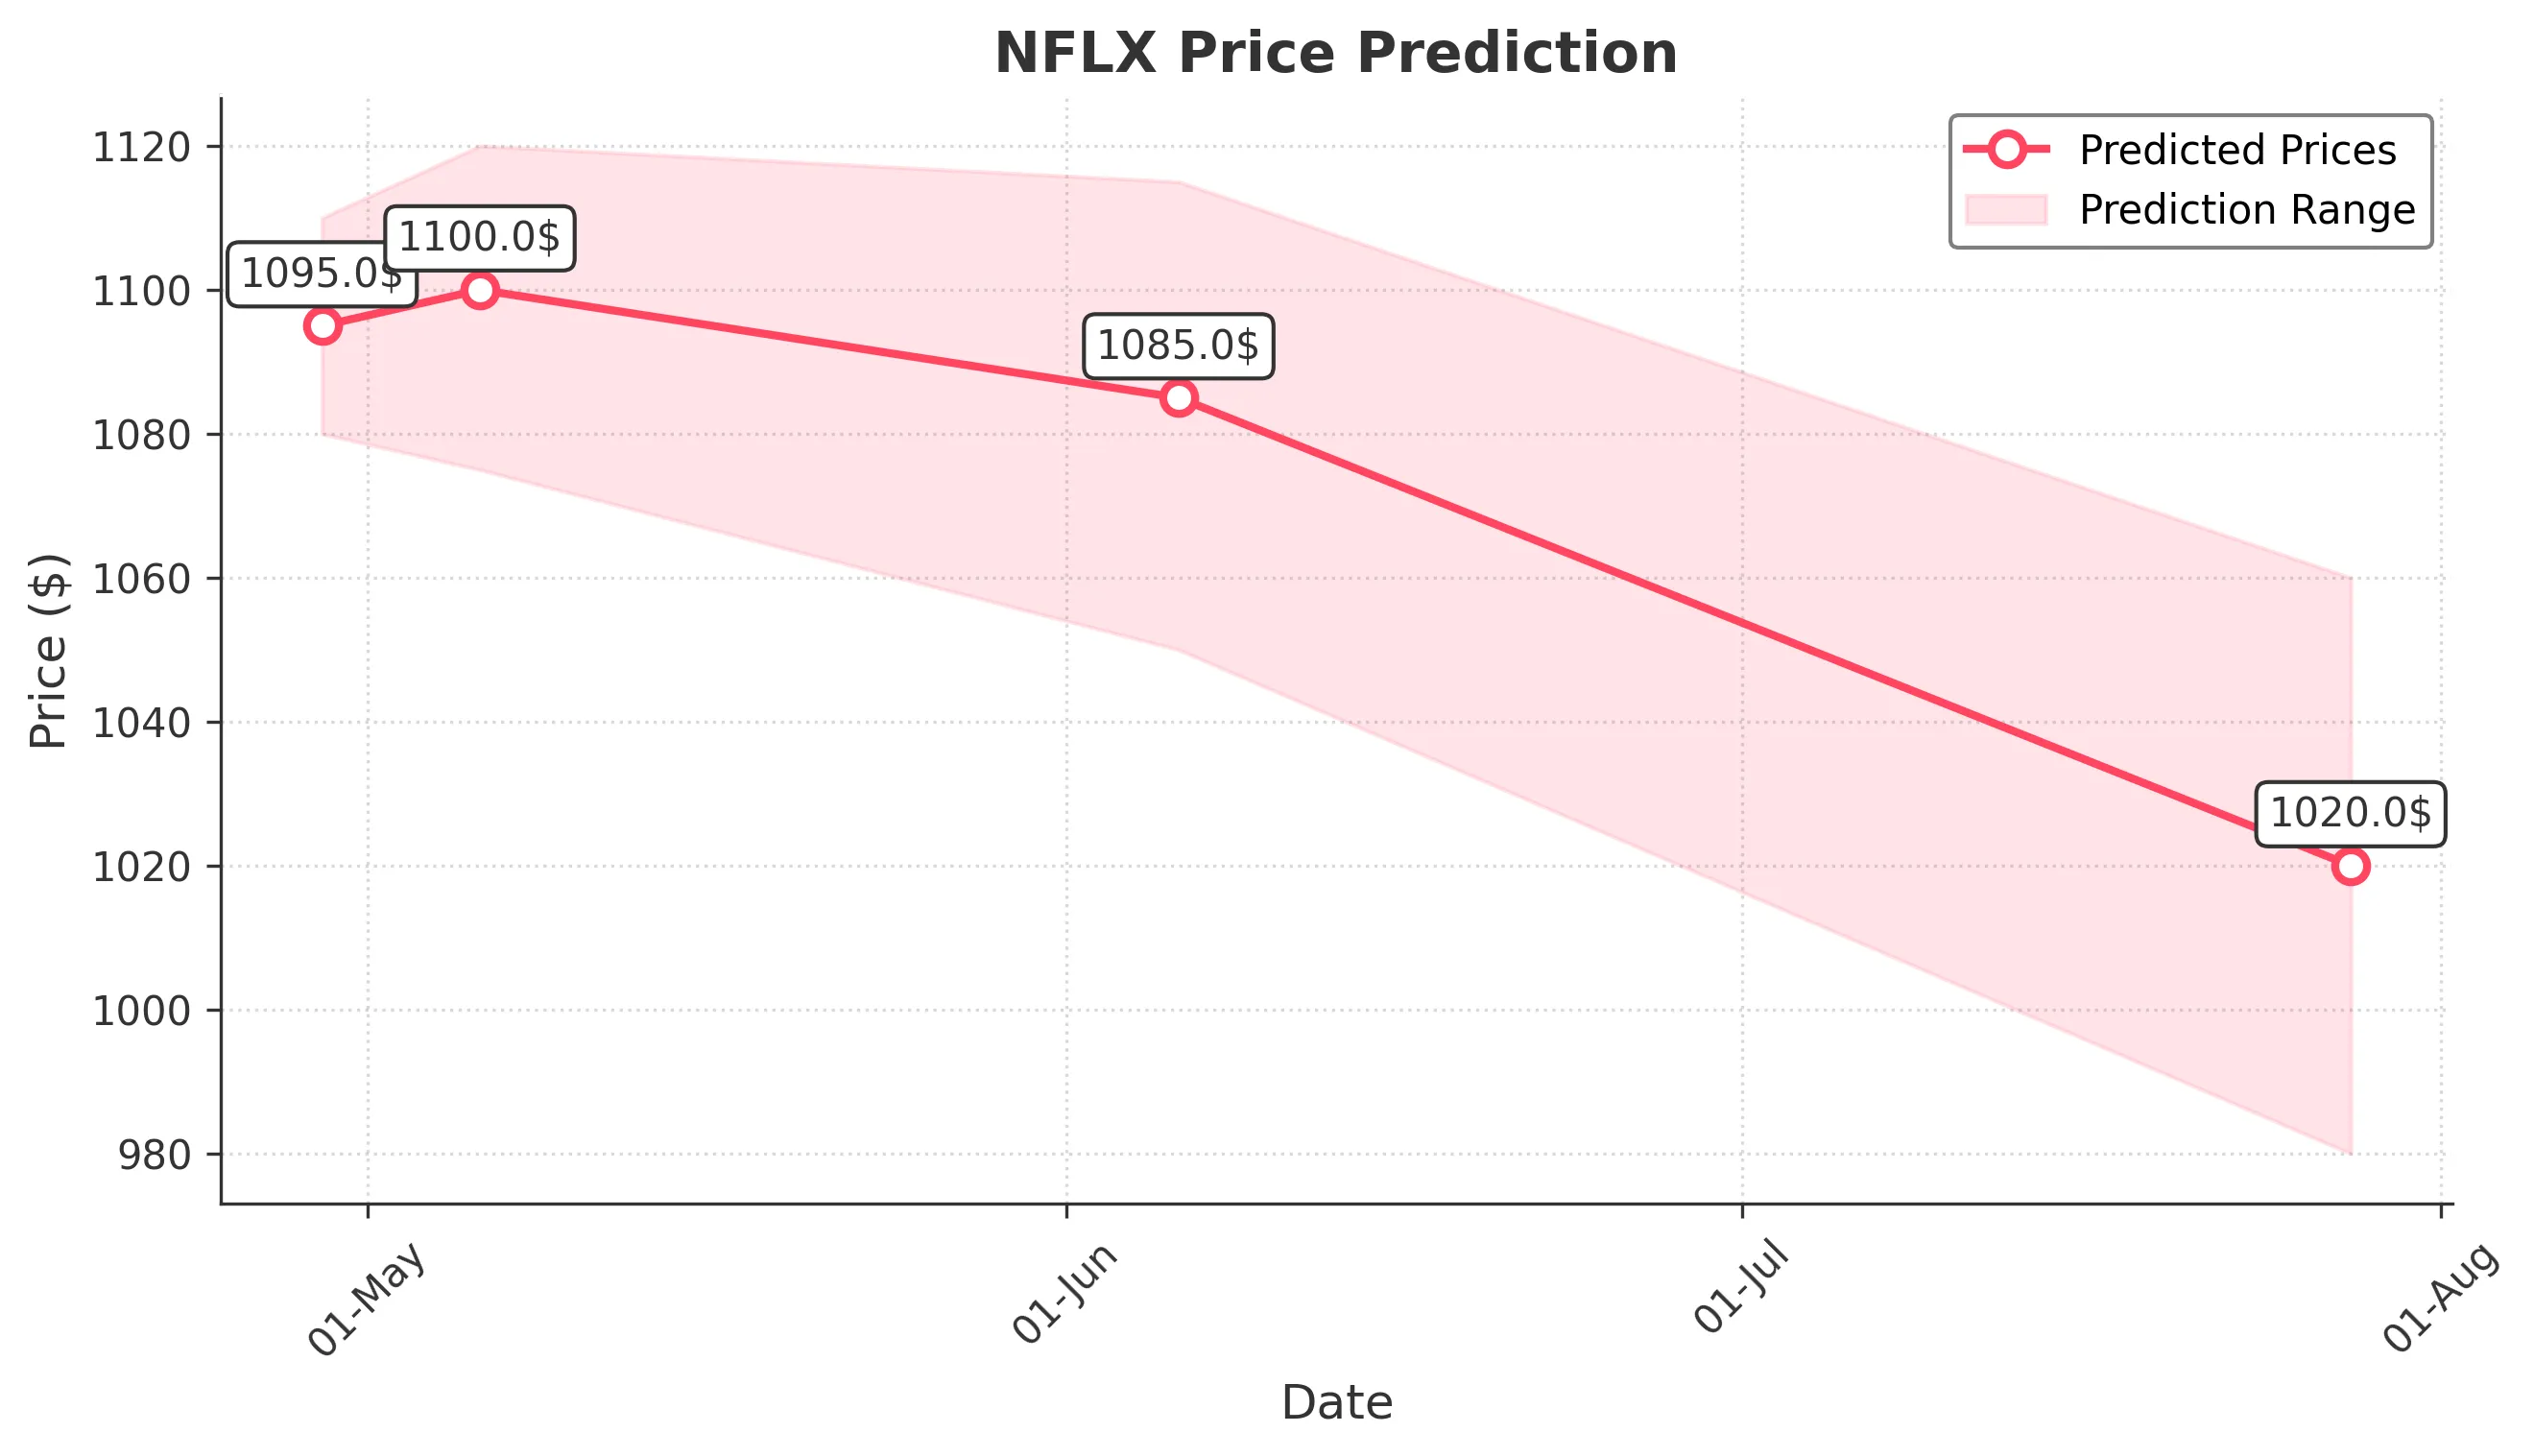
Target: April 29, 2025$1095
$1090
$1110
$1080
Description
The stock shows bullish momentum with a recent upward trend. The MACD is positive, and RSI indicates strength. A Doji pattern suggests indecision, but overall sentiment remains bullish. Expect slight profit-taking, leading to a minor pullback.
Analysis
NFLX has shown a strong bullish trend over the past three months, with significant support at $1000 and resistance around $1100. The recent price action indicates a healthy upward trajectory, supported by increasing volume. However, the market sentiment could shift due to macroeconomic factors.
Confidence Level
Potential Risks
Potential market volatility and profit-taking could lead to unexpected price movements.
1 Week Prediction
Target: May 6, 2025$1100
$1095
$1120
$1075
Description
The bullish trend is expected to continue, with strong support at $1080. The MACD remains positive, and the RSI is approaching overbought territory, indicating potential for a pullback. However, overall sentiment remains optimistic.
Analysis
Over the past three months, NFLX has experienced significant price increases, with key resistance levels at $1100. The volume has been robust, indicating strong interest. However, the RSI suggests caution as it approaches overbought levels, which could lead to volatility.
Confidence Level
Potential Risks
Market corrections or negative news could impact the stock's performance.
1 Month Prediction
Target: June 6, 2025$1085
$1100
$1115
$1050
Description
Expect a slight pullback as the stock approaches resistance levels. The RSI indicates overbought conditions, and profit-taking may occur. However, the overall trend remains bullish, supported by strong fundamentals.
Analysis
NFLX has shown a strong upward trend, but the recent price action suggests a potential consolidation phase. Key support is at $1050, while resistance is at $1115. The volume patterns indicate strong buying interest, but caution is warranted as the stock approaches overbought conditions.
Confidence Level
Potential Risks
Market sentiment could shift due to external factors, impacting the stock's performance.
3 Months Prediction
Target: July 28, 2025$1020
$1000
$1060
$980
Description
A potential bearish reversal is anticipated as the stock approaches key resistance levels. The MACD may turn negative, and the RSI indicates overbought conditions. Market sentiment could shift due to macroeconomic factors.
Analysis
The stock has shown strong performance, but the potential for a reversal exists as it approaches historical resistance levels. Key support is at $980, and the market sentiment may shift due to external economic factors. The overall trend remains uncertain, with both bullish and bearish signals present.
Confidence Level
Potential Risks
Unforeseen market events or earnings reports could significantly impact the stock's trajectory.