NFLX Trading Predictions
1 Day Prediction
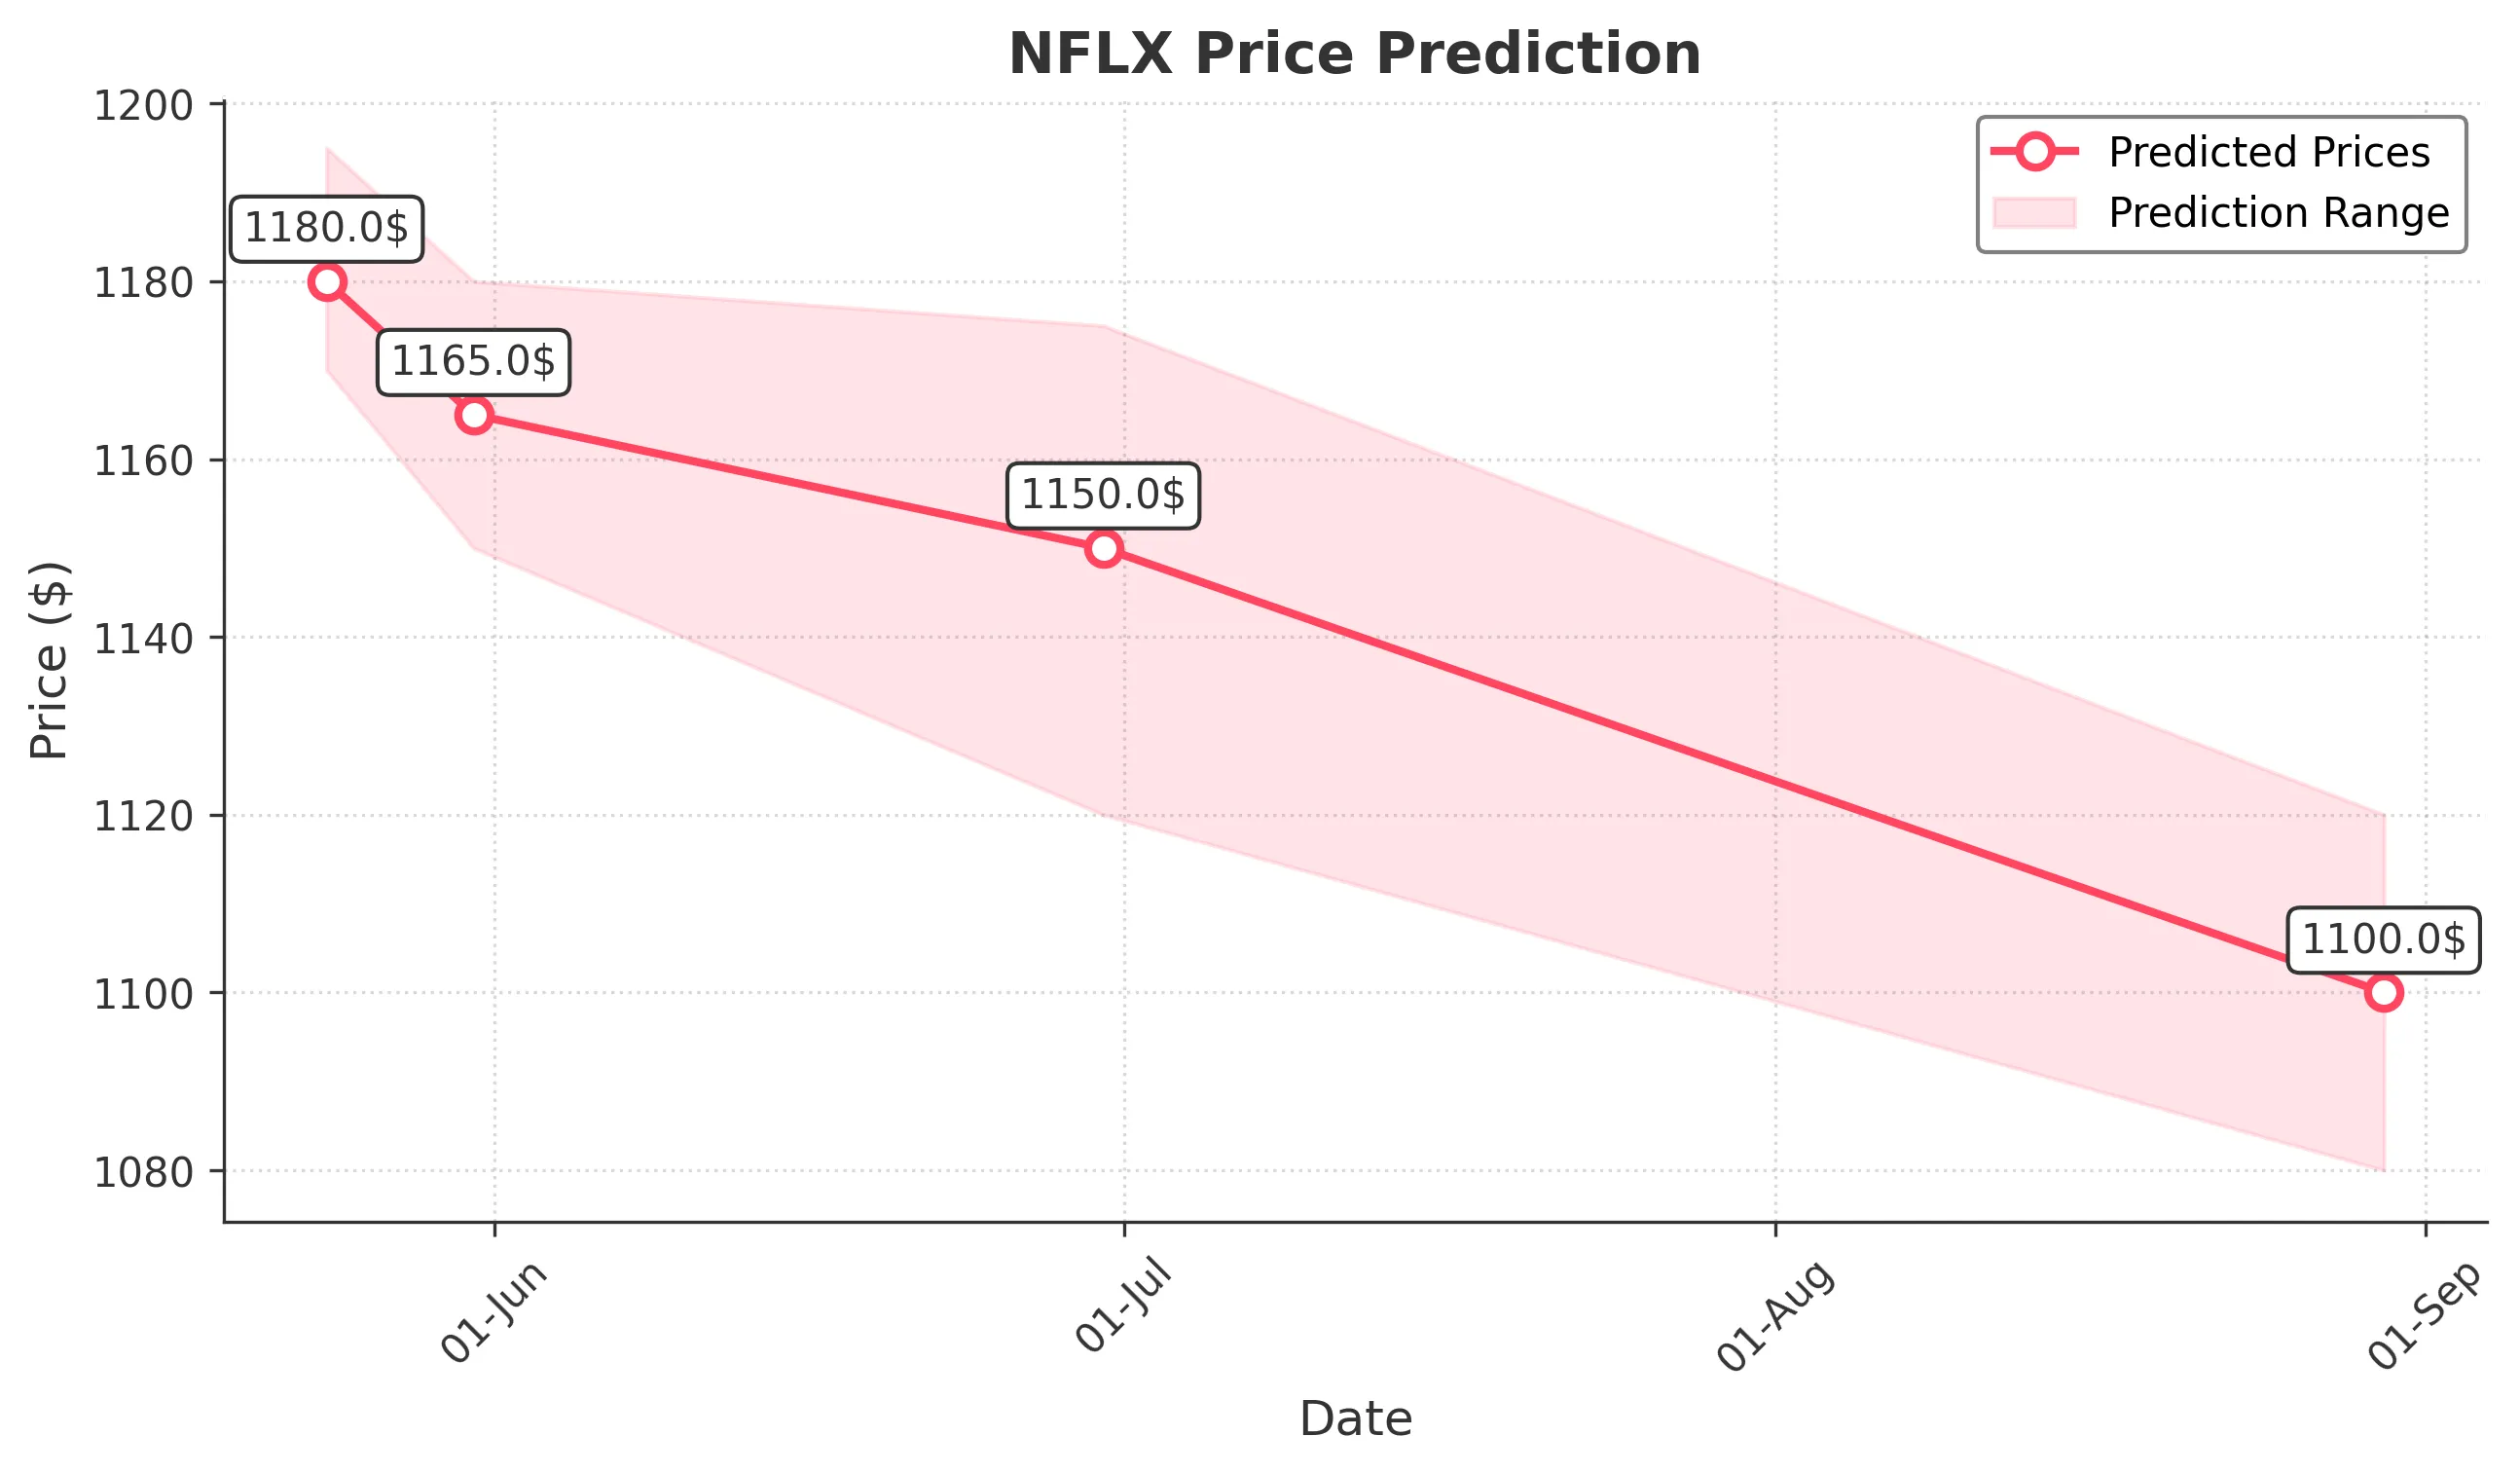
Target: May 24, 2025$1180
$1185
$1195
$1170
Description
The stock shows a slight bearish trend with a recent Doji candlestick indicating indecision. RSI is at 55, suggesting a neutral momentum. A potential pullback is expected, but support at 1170 may hold.
Analysis
NFLX has shown a bullish trend over the past three months, with significant resistance at 1200. Recent price action indicates a potential consolidation phase. Volume has decreased, suggesting weakening momentum. Key support is at 1170.
Confidence Level
Potential Risks
Market volatility and external news could impact the price significantly.
1 Week Prediction
Target: May 31, 2025$1165
$1170
$1180
$1150
Description
Expect a slight decline as the stock approaches resistance levels. The MACD shows a bearish crossover, and the Bollinger Bands are tightening, indicating potential volatility. Watch for support at 1150.
Analysis
The stock has been in a bullish trend but is showing signs of exhaustion. The RSI is nearing overbought territory, and recent volume spikes suggest profit-taking. Key support at 1150 is critical for maintaining upward momentum.
Confidence Level
Potential Risks
Unforeseen market events or earnings reports could lead to unexpected price movements.
1 Month Prediction
Target: June 30, 2025$1150
$1160
$1175
$1120
Description
A bearish outlook as the stock may retrace towards the Fibonacci level of 1150. The ATR indicates increasing volatility, and the recent bearish engulfing pattern suggests a potential reversal.
Analysis
NFLX has experienced a strong rally but is now facing resistance. The stock's performance is influenced by broader market trends and potential earnings announcements. Key support at 1120 could be tested if bearish momentum continues.
Confidence Level
Potential Risks
Market sentiment and macroeconomic factors could lead to unexpected fluctuations.
3 Months Prediction
Target: August 30, 2025$1100
$1110
$1120
$1080
Description
Long-term bearish sentiment as the stock may continue to decline towards the 1100 support level. The MACD remains negative, and the RSI indicates oversold conditions, suggesting a potential bounce but overall weakness.
Analysis
Over the past three months, NFLX has shown a bearish trend with significant resistance at 1200. The stock's volatility has increased, and recent trading patterns indicate a potential downtrend. Key support at 1100 is critical for future performance.
Confidence Level
Potential Risks
Economic conditions and competitive pressures could further impact the stock's performance.