NFLX Trading Predictions
1 Day Prediction
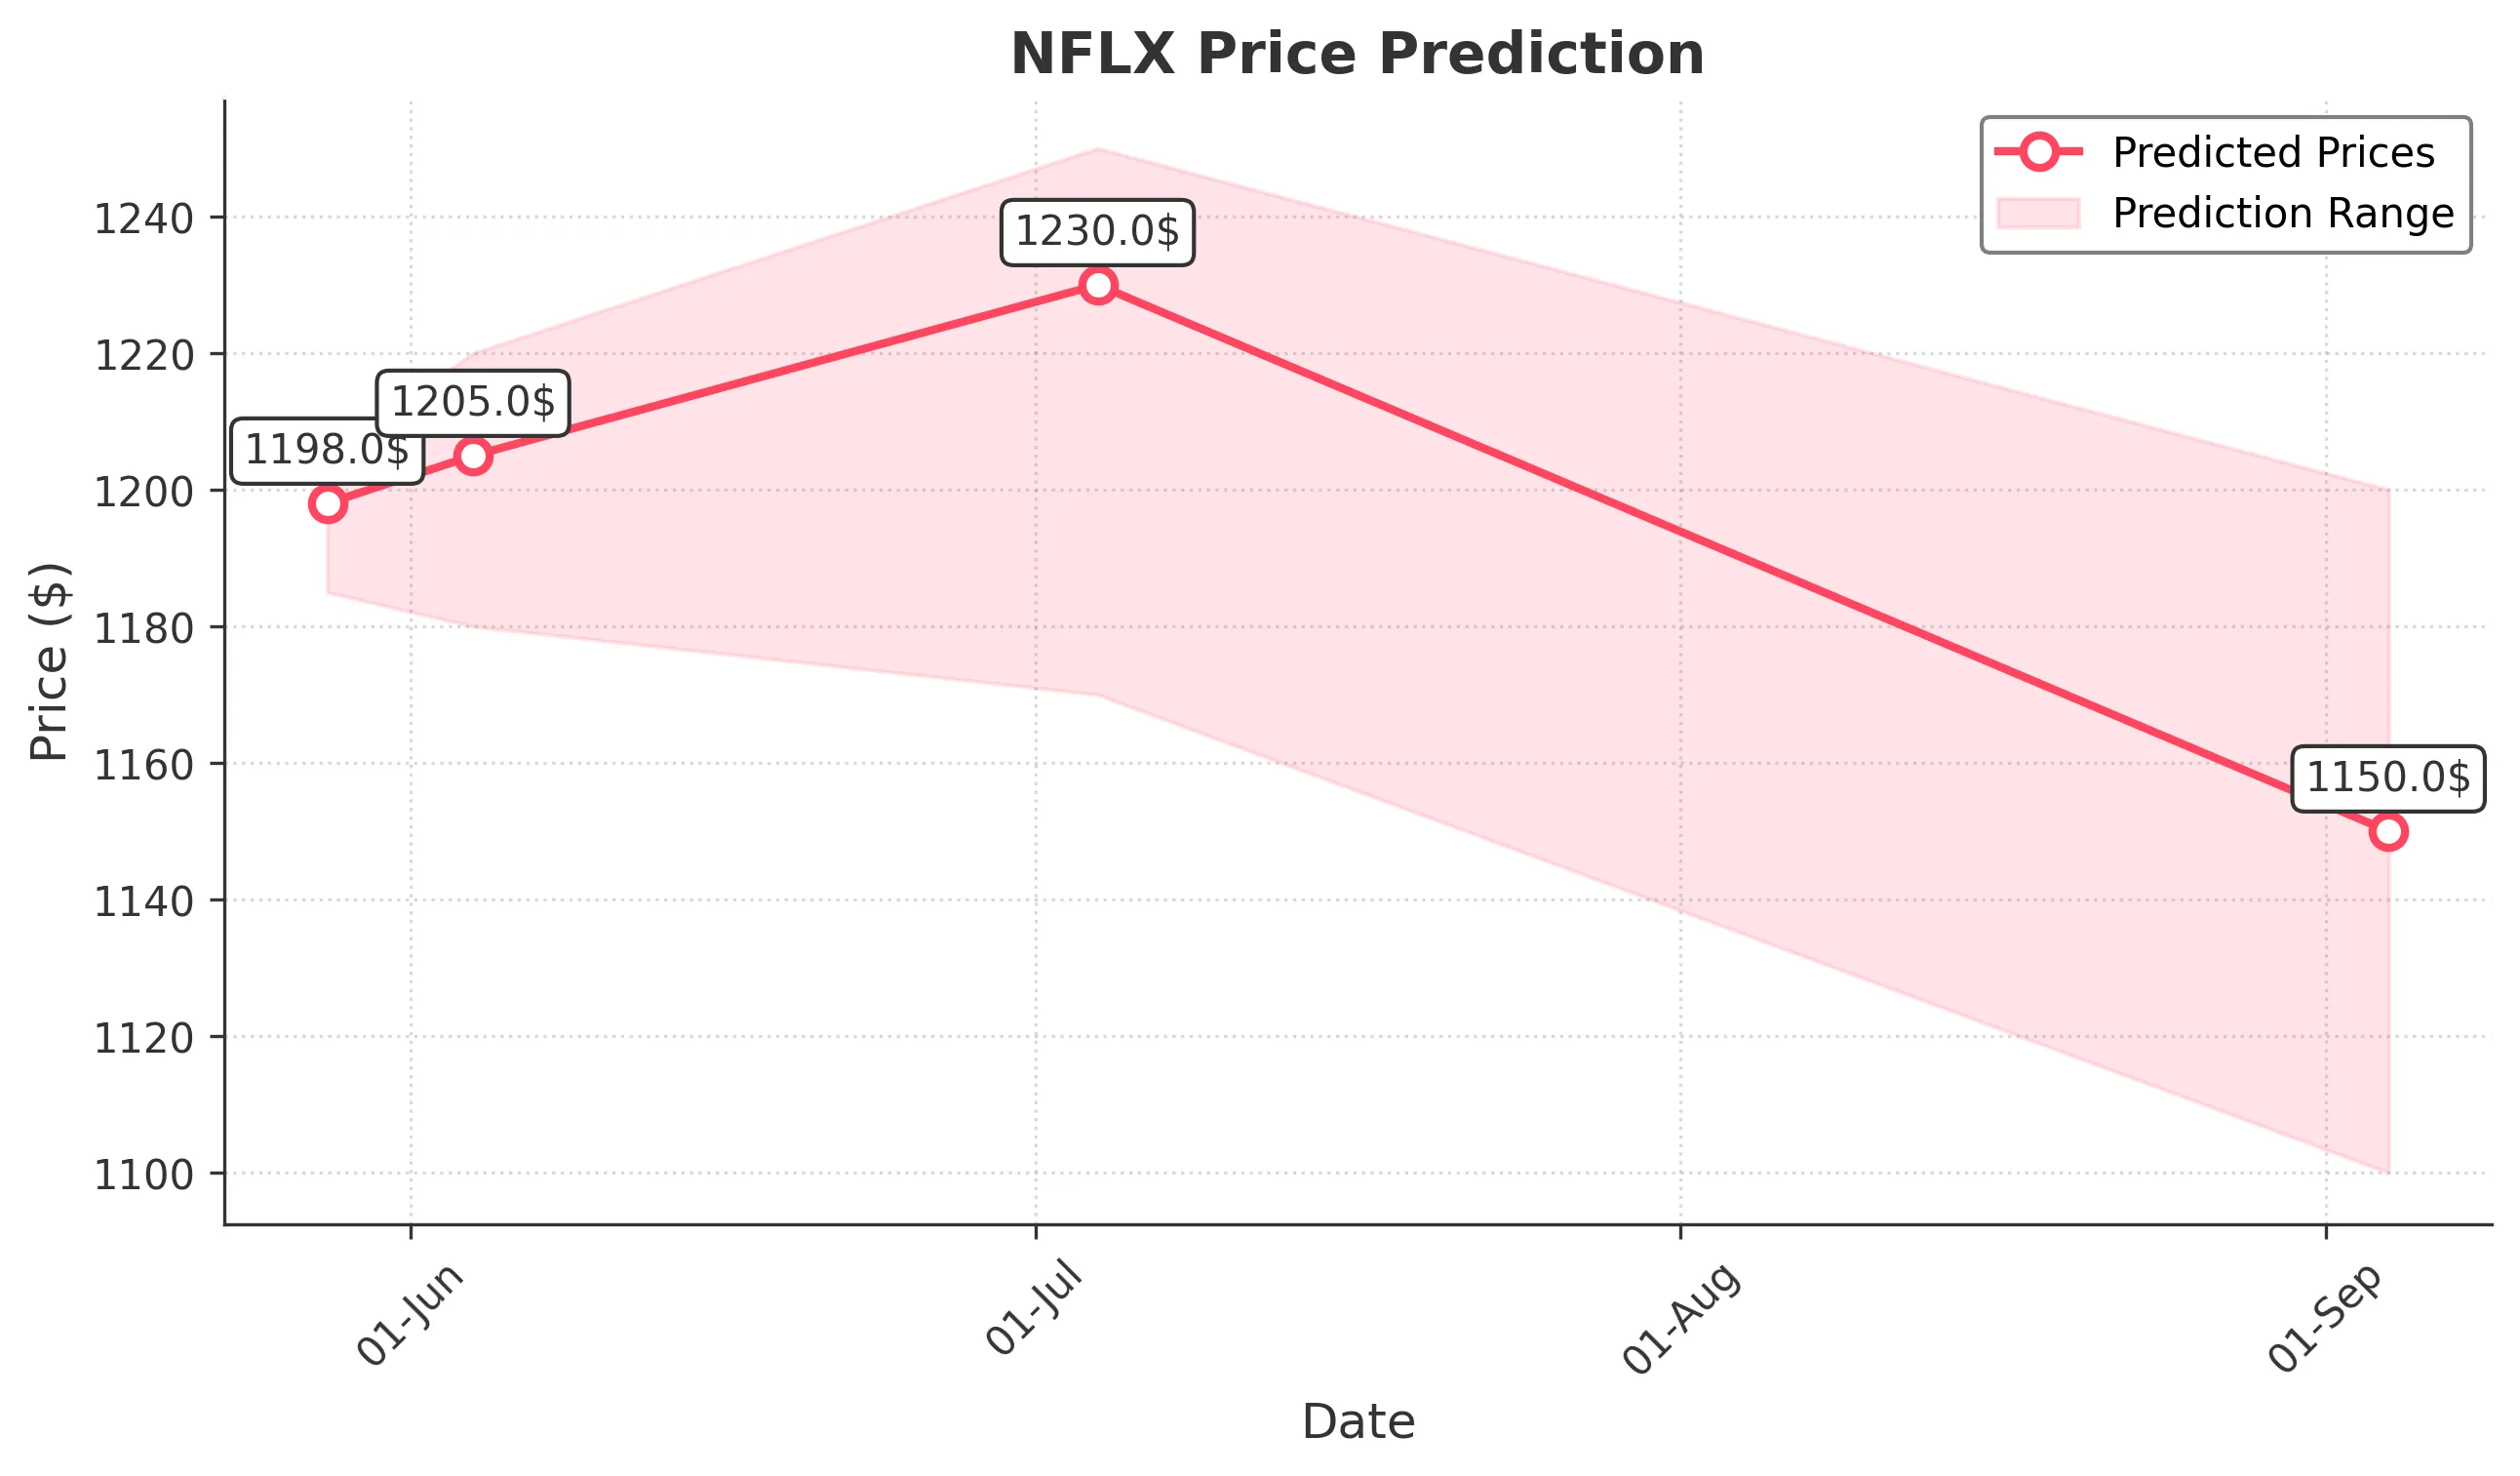
Target: May 28, 2025$1198
$1195
$1205
$1185
Description
The stock shows a bullish trend with a recent upward momentum. The RSI is nearing overbought levels, indicating potential consolidation. A Doji pattern suggests indecision, but overall sentiment remains positive. Volume is expected to decrease slightly.
Analysis
NFLX has shown a strong bullish trend over the past three months, with significant support at $1150 and resistance around $1200. The recent price action indicates a possible continuation of this trend, although the RSI suggests caution as it approaches overbought territory.
Confidence Level
Potential Risks
Potential market volatility and profit-taking could lead to a pullback.
1 Week Prediction
Target: June 4, 2025$1205
$1198
$1220
$1180
Description
The bullish trend is expected to continue, supported by strong buying pressure. The MACD shows a bullish crossover, and the price is above the 20-day moving average. However, the RSI indicates potential overbought conditions.
Analysis
Over the past three months, NFLX has experienced significant upward movement, with key resistance at $1220. The stock's volatility has increased, and while the trend remains bullish, caution is warranted due to potential market corrections.
Confidence Level
Potential Risks
Market corrections or negative news could impact the stock's performance.
1 Month Prediction
Target: July 4, 2025$1230
$1205
$1250
$1170
Description
The stock is likely to reach new highs as bullish sentiment persists. Fibonacci retracement levels suggest support at $1180, while the upper resistance is around $1250. The overall market sentiment remains positive.
Analysis
NFLX has shown a strong bullish trend, with significant support at $1180 and resistance at $1250. The stock's performance has been buoyed by positive market sentiment, but caution is advised as external factors could introduce volatility.
Confidence Level
Potential Risks
External economic factors or earnings reports could lead to volatility.
3 Months Prediction
Target: September 4, 2025$1150
$1200
$1200
$1100
Description
A potential bearish reversal is indicated as the stock approaches resistance levels. The MACD shows signs of divergence, and the RSI is overbought. A correction may occur, leading to a decline in price.
Analysis
Over the past three months, NFLX has experienced significant volatility, with a strong bullish trend followed by signs of potential reversal. Key resistance levels are being tested, and while the stock has performed well, caution is warranted as market conditions may change.
Confidence Level
Potential Risks
Market sentiment could shift rapidly due to economic news or earnings reports.