NFLX Trading Predictions
1 Day Prediction
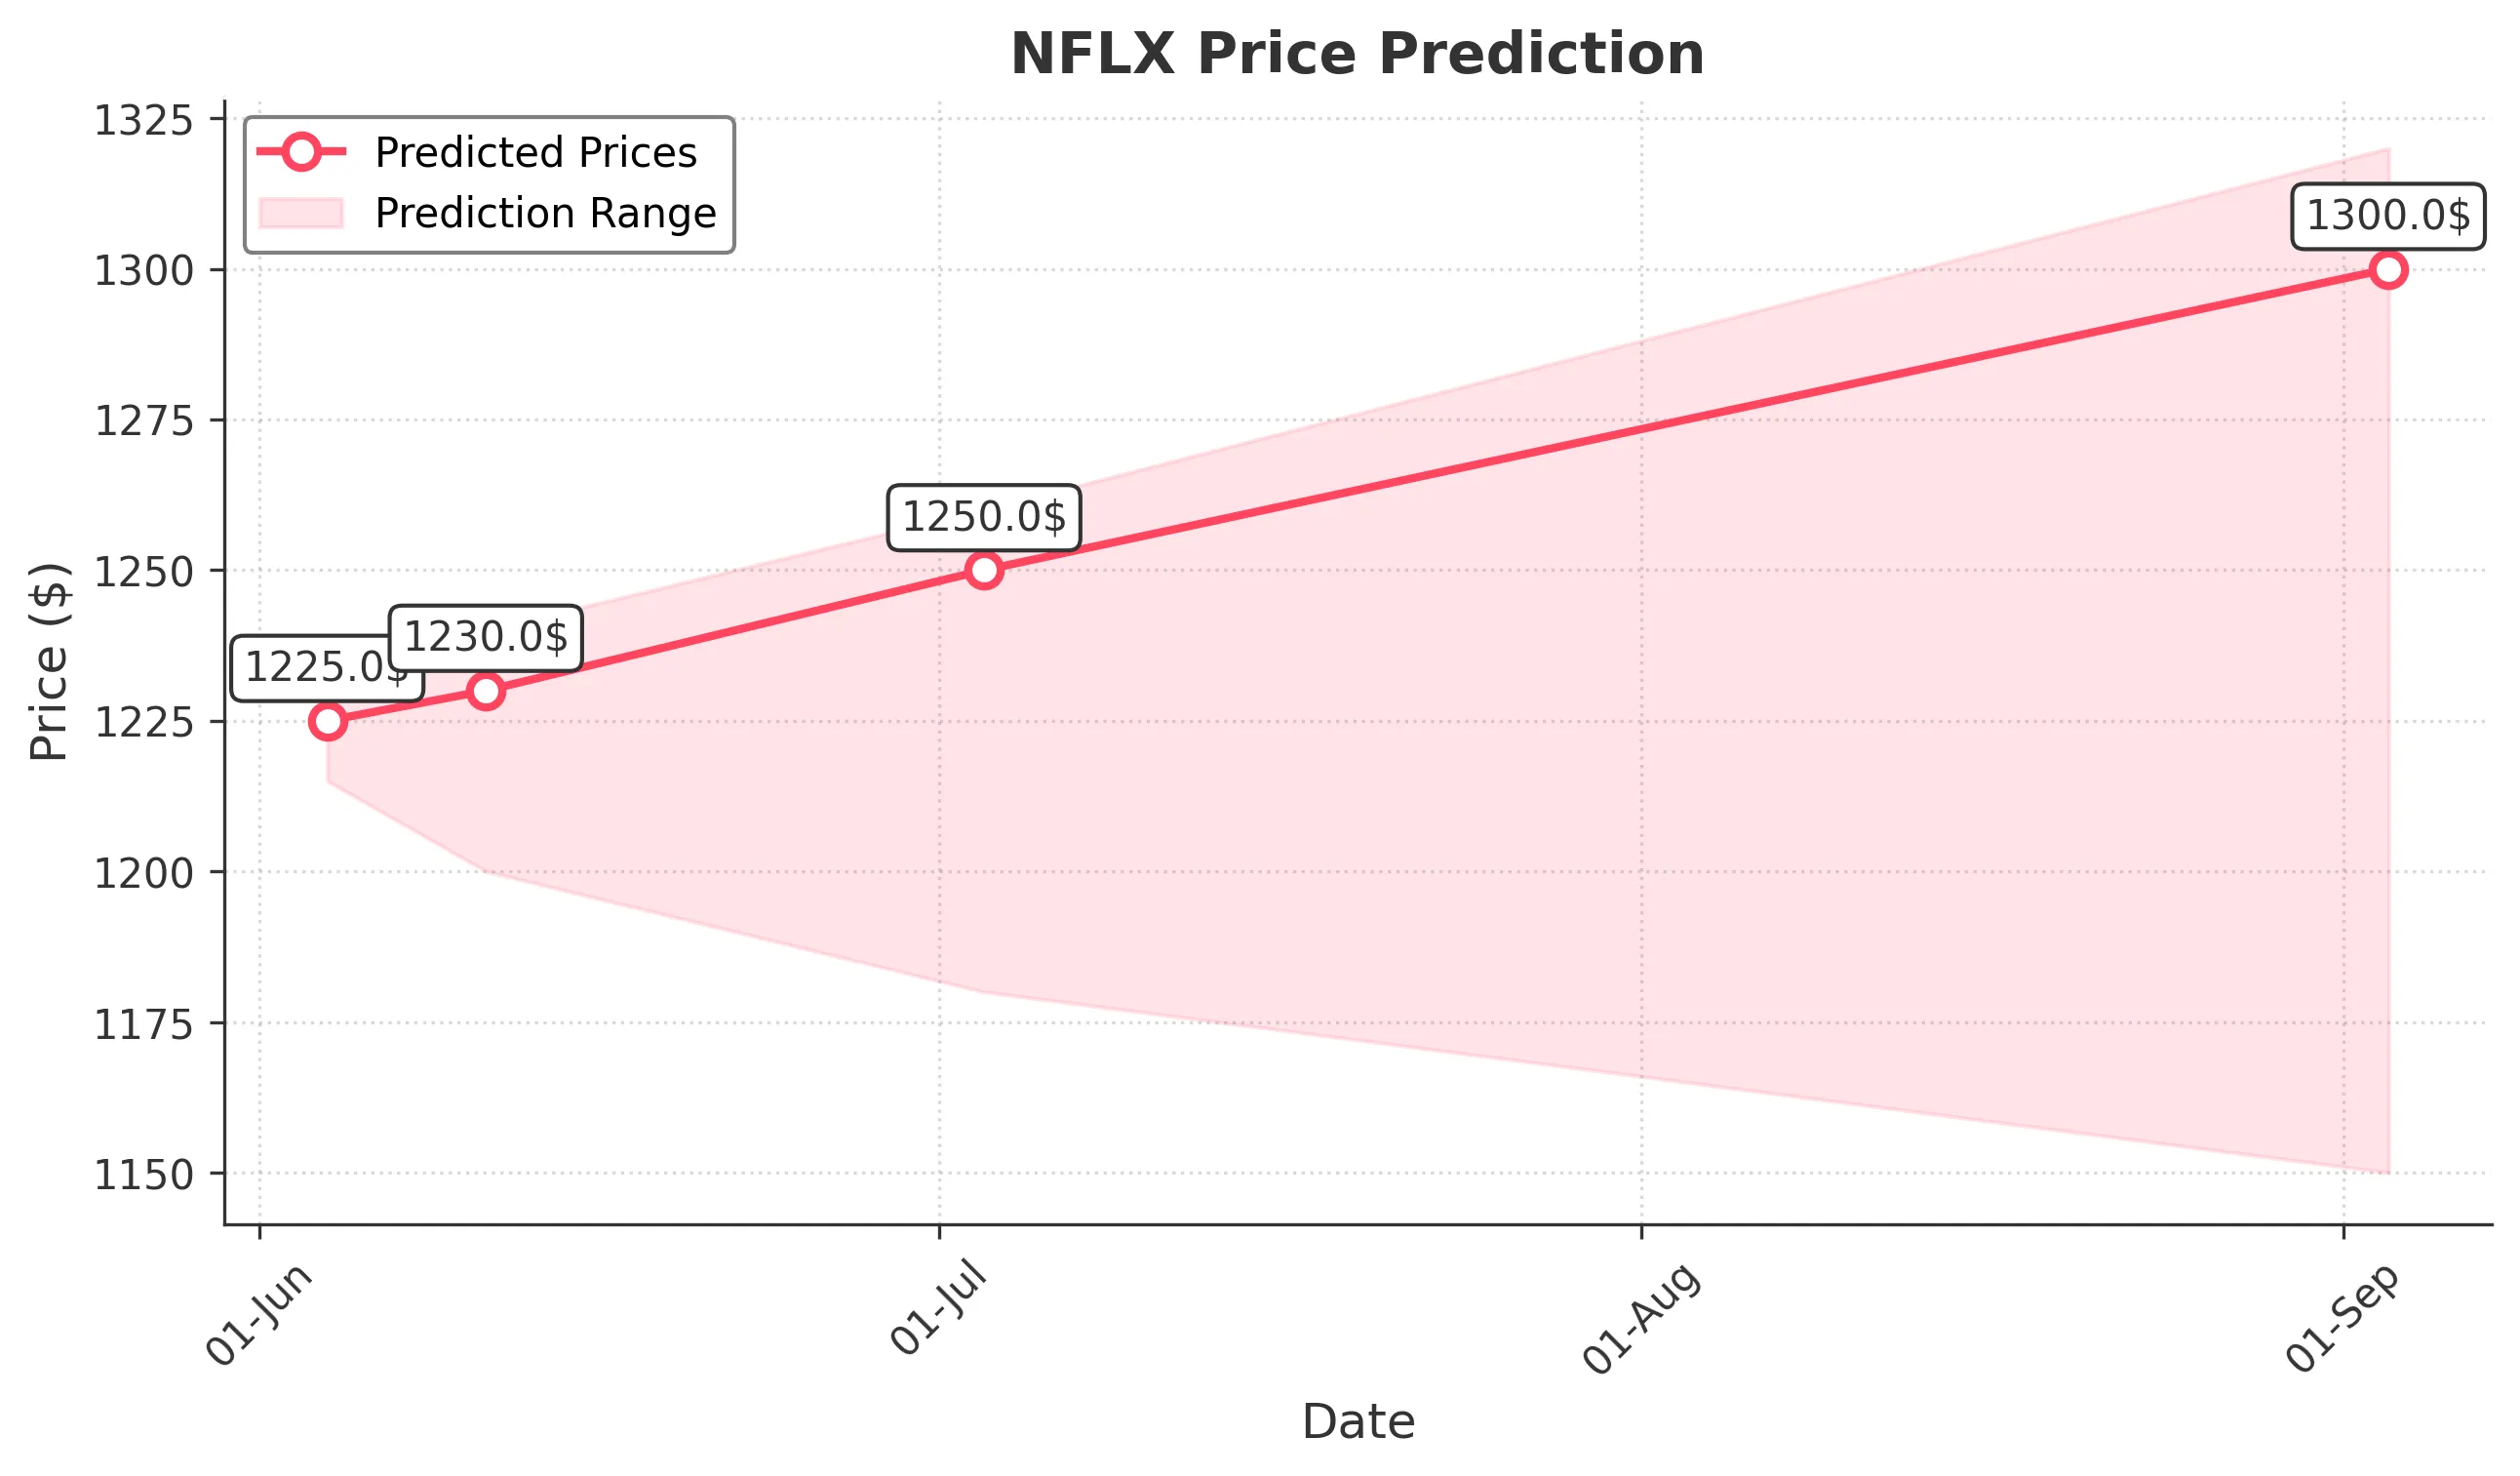
Target: June 4, 2025$1225
$1220
$1230
$1215
Description
The stock shows bullish momentum with a recent upward trend. The RSI is approaching overbought levels, indicating potential for a pullback. However, strong support at 1215.00 suggests a likely bounce back. Volume remains stable, supporting the upward movement.
Analysis
Over the past 3 months, NFLX has shown a bullish trend, with significant resistance at 1230.00 and support around 1215.00. The MACD indicates upward momentum, while the ATR suggests moderate volatility. Recent volume spikes indicate strong buying interest.
Confidence Level
Potential Risks
Potential market volatility could impact the prediction, especially if external news affects sentiment.
1 Week Prediction
Target: June 11, 2025$1230
$1225
$1240
$1200
Description
The stock is expected to maintain its bullish trend, with the MACD remaining positive. However, the RSI indicates overbought conditions, suggesting a possible pullback. The support level at 1215.00 should hold, allowing for a gradual rise.
Analysis
NFLX has been on an upward trajectory, with key resistance at 1240.00. The recent candlestick patterns show bullish engulfing formations, indicating strong buying pressure. Volume analysis shows consistent interest, but caution is advised due to potential overbought conditions.
Confidence Level
Potential Risks
Market sentiment can shift quickly, and any negative news could lead to a reversal.
1 Month Prediction
Target: July 3, 2025$1250
$1230
$1260
$1180
Description
The stock is likely to continue its upward trend, supported by strong fundamentals. However, the RSI suggests a potential correction. The Fibonacci retracement levels indicate support at 1215.00, which should help maintain the upward trajectory.
Analysis
In the last three months, NFLX has shown a strong bullish trend, with significant resistance at 1260.00. The MACD is bullish, but the RSI indicates potential overbought conditions. Volume patterns suggest sustained interest, but caution is warranted as market conditions can change.
Confidence Level
Potential Risks
Economic factors and earnings reports could introduce volatility, impacting the stock's performance.
3 Months Prediction
Target: September 3, 2025$1300
$1250
$1320
$1150
Description
Long-term bullish sentiment is expected, driven by strong earnings and market position. However, the potential for market corrections exists, especially if economic conditions worsen. Support at 1215.00 remains critical.
Analysis
NFLX has shown a robust performance over the past three months, with a clear bullish trend. Key resistance is at 1320.00, while support at 1215.00 is crucial. The MACD remains positive, but the RSI indicates potential overbought conditions, suggesting a need for caution.
Confidence Level
Potential Risks
Unforeseen macroeconomic events or changes in market sentiment could lead to significant volatility.