NFLX Trading Predictions
1 Day Prediction
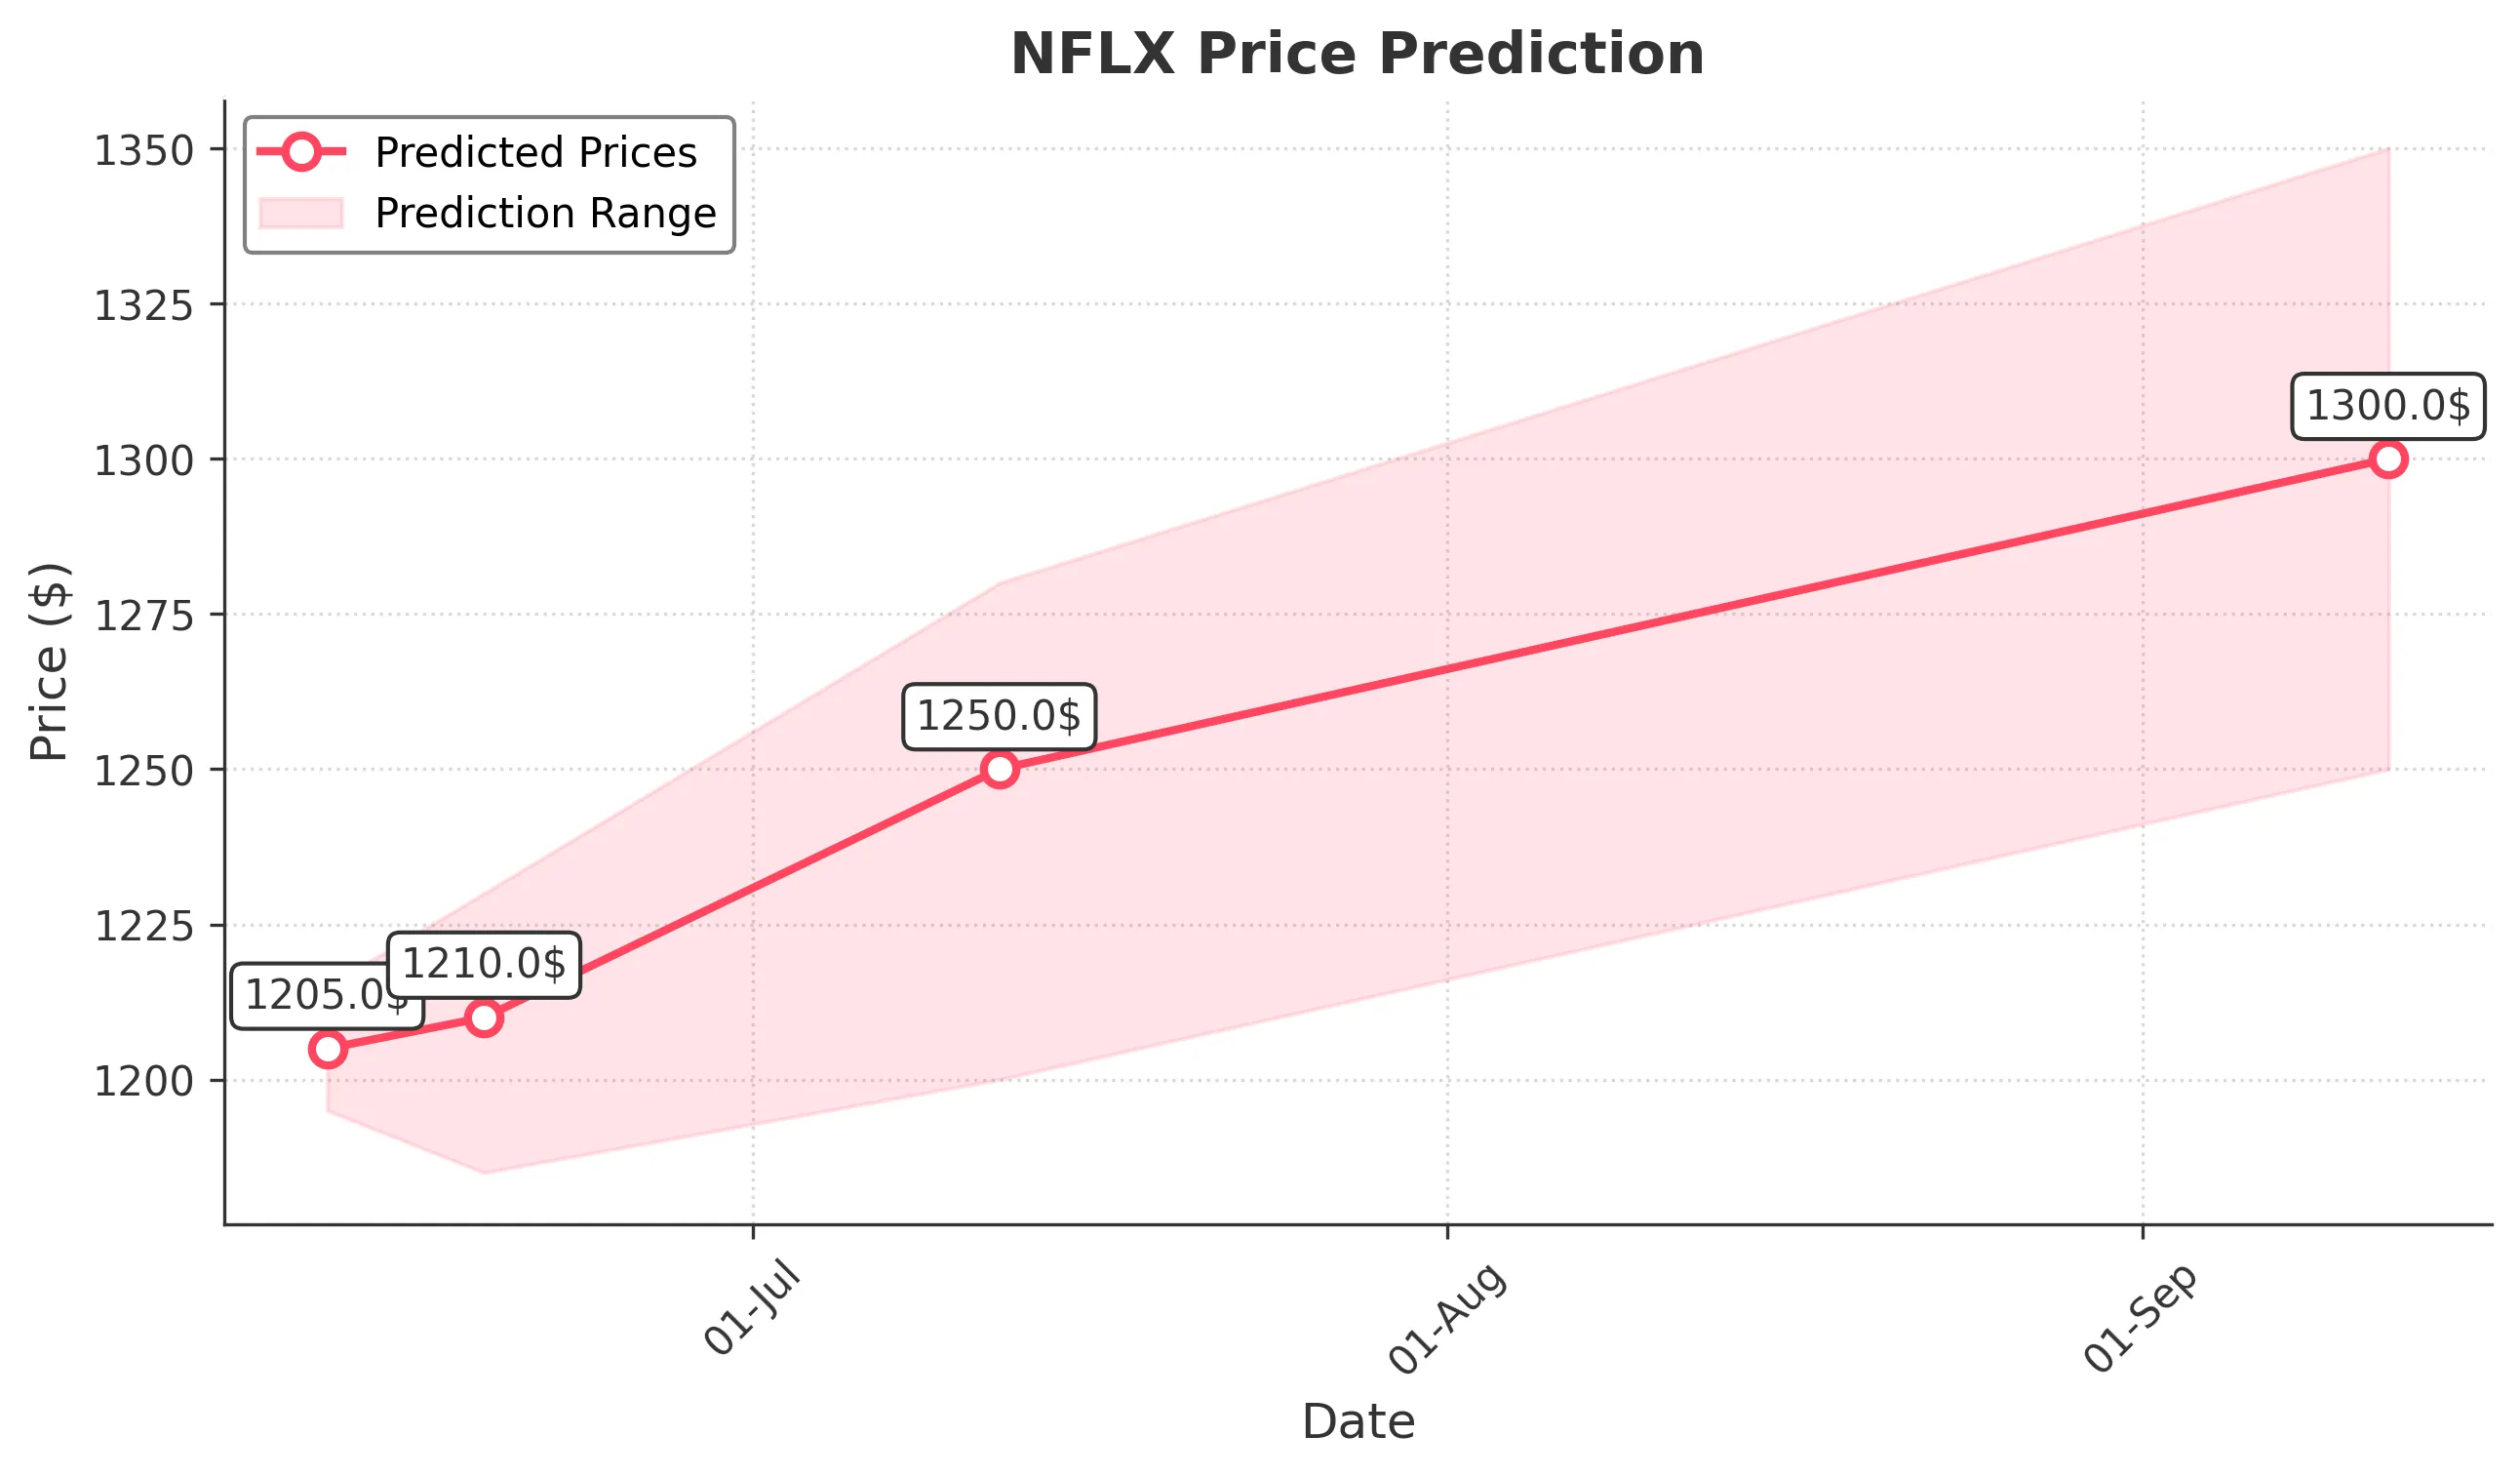
Target: June 12, 2025$1205
$1205
$1215
$1195
Description
The stock shows a slight bearish trend with a recent Doji candlestick indicating indecision. RSI is near 50, suggesting a potential reversal. Volume is decreasing, indicating weakening momentum. Expect a close around 1205.
Analysis
NFLX has shown a sideways trend recently, with key support at 1200 and resistance at 1250. The RSI indicates neutral momentum, while MACD is flattening, suggesting potential consolidation. Volume has been declining, indicating reduced interest.
Confidence Level
Potential Risks
Market volatility and external news could impact the price significantly.
1 Week Prediction
Target: June 19, 2025$1210
$1205
$1230
$1185
Description
Expect a slight upward movement as the stock may find support at 1200. The MACD shows a bullish crossover, and the RSI is improving. However, watch for potential resistance at 1230.
Analysis
The stock has been consolidating around 1200-1250. Recent bullish signals from MACD and a potential breakout above 1210 could lead to further gains. However, the market sentiment remains cautious.
Confidence Level
Potential Risks
Any negative macroeconomic news could reverse this trend.
1 Month Prediction
Target: July 12, 2025$1250
$1210
$1280
$1200
Description
A bullish trend is anticipated as the stock approaches key Fibonacci retracement levels. The MACD remains positive, and RSI is trending upwards, indicating strong buying interest.
Analysis
NFLX has shown a bullish trend with strong support at 1200. The recent price action suggests a potential breakout above 1250, with volume increasing. The overall sentiment is positive, but external factors could impact performance.
Confidence Level
Potential Risks
Market corrections or earnings reports could introduce volatility.
3 Months Prediction
Target: September 12, 2025$1300
$1260
$1350
$1250
Description
Long-term bullish sentiment is expected as the stock may break through resistance levels. The overall market sentiment is positive, and technical indicators support upward momentum.
Analysis
Over the past three months, NFLX has shown a strong upward trend, with significant support at 1200 and resistance at 1300. The MACD and RSI indicate bullish momentum, while volume patterns suggest increasing interest. However, external factors could introduce risks.
Confidence Level
Potential Risks
Economic downturns or competitive pressures could affect growth.