NFLX Trading Predictions
1 Day Prediction
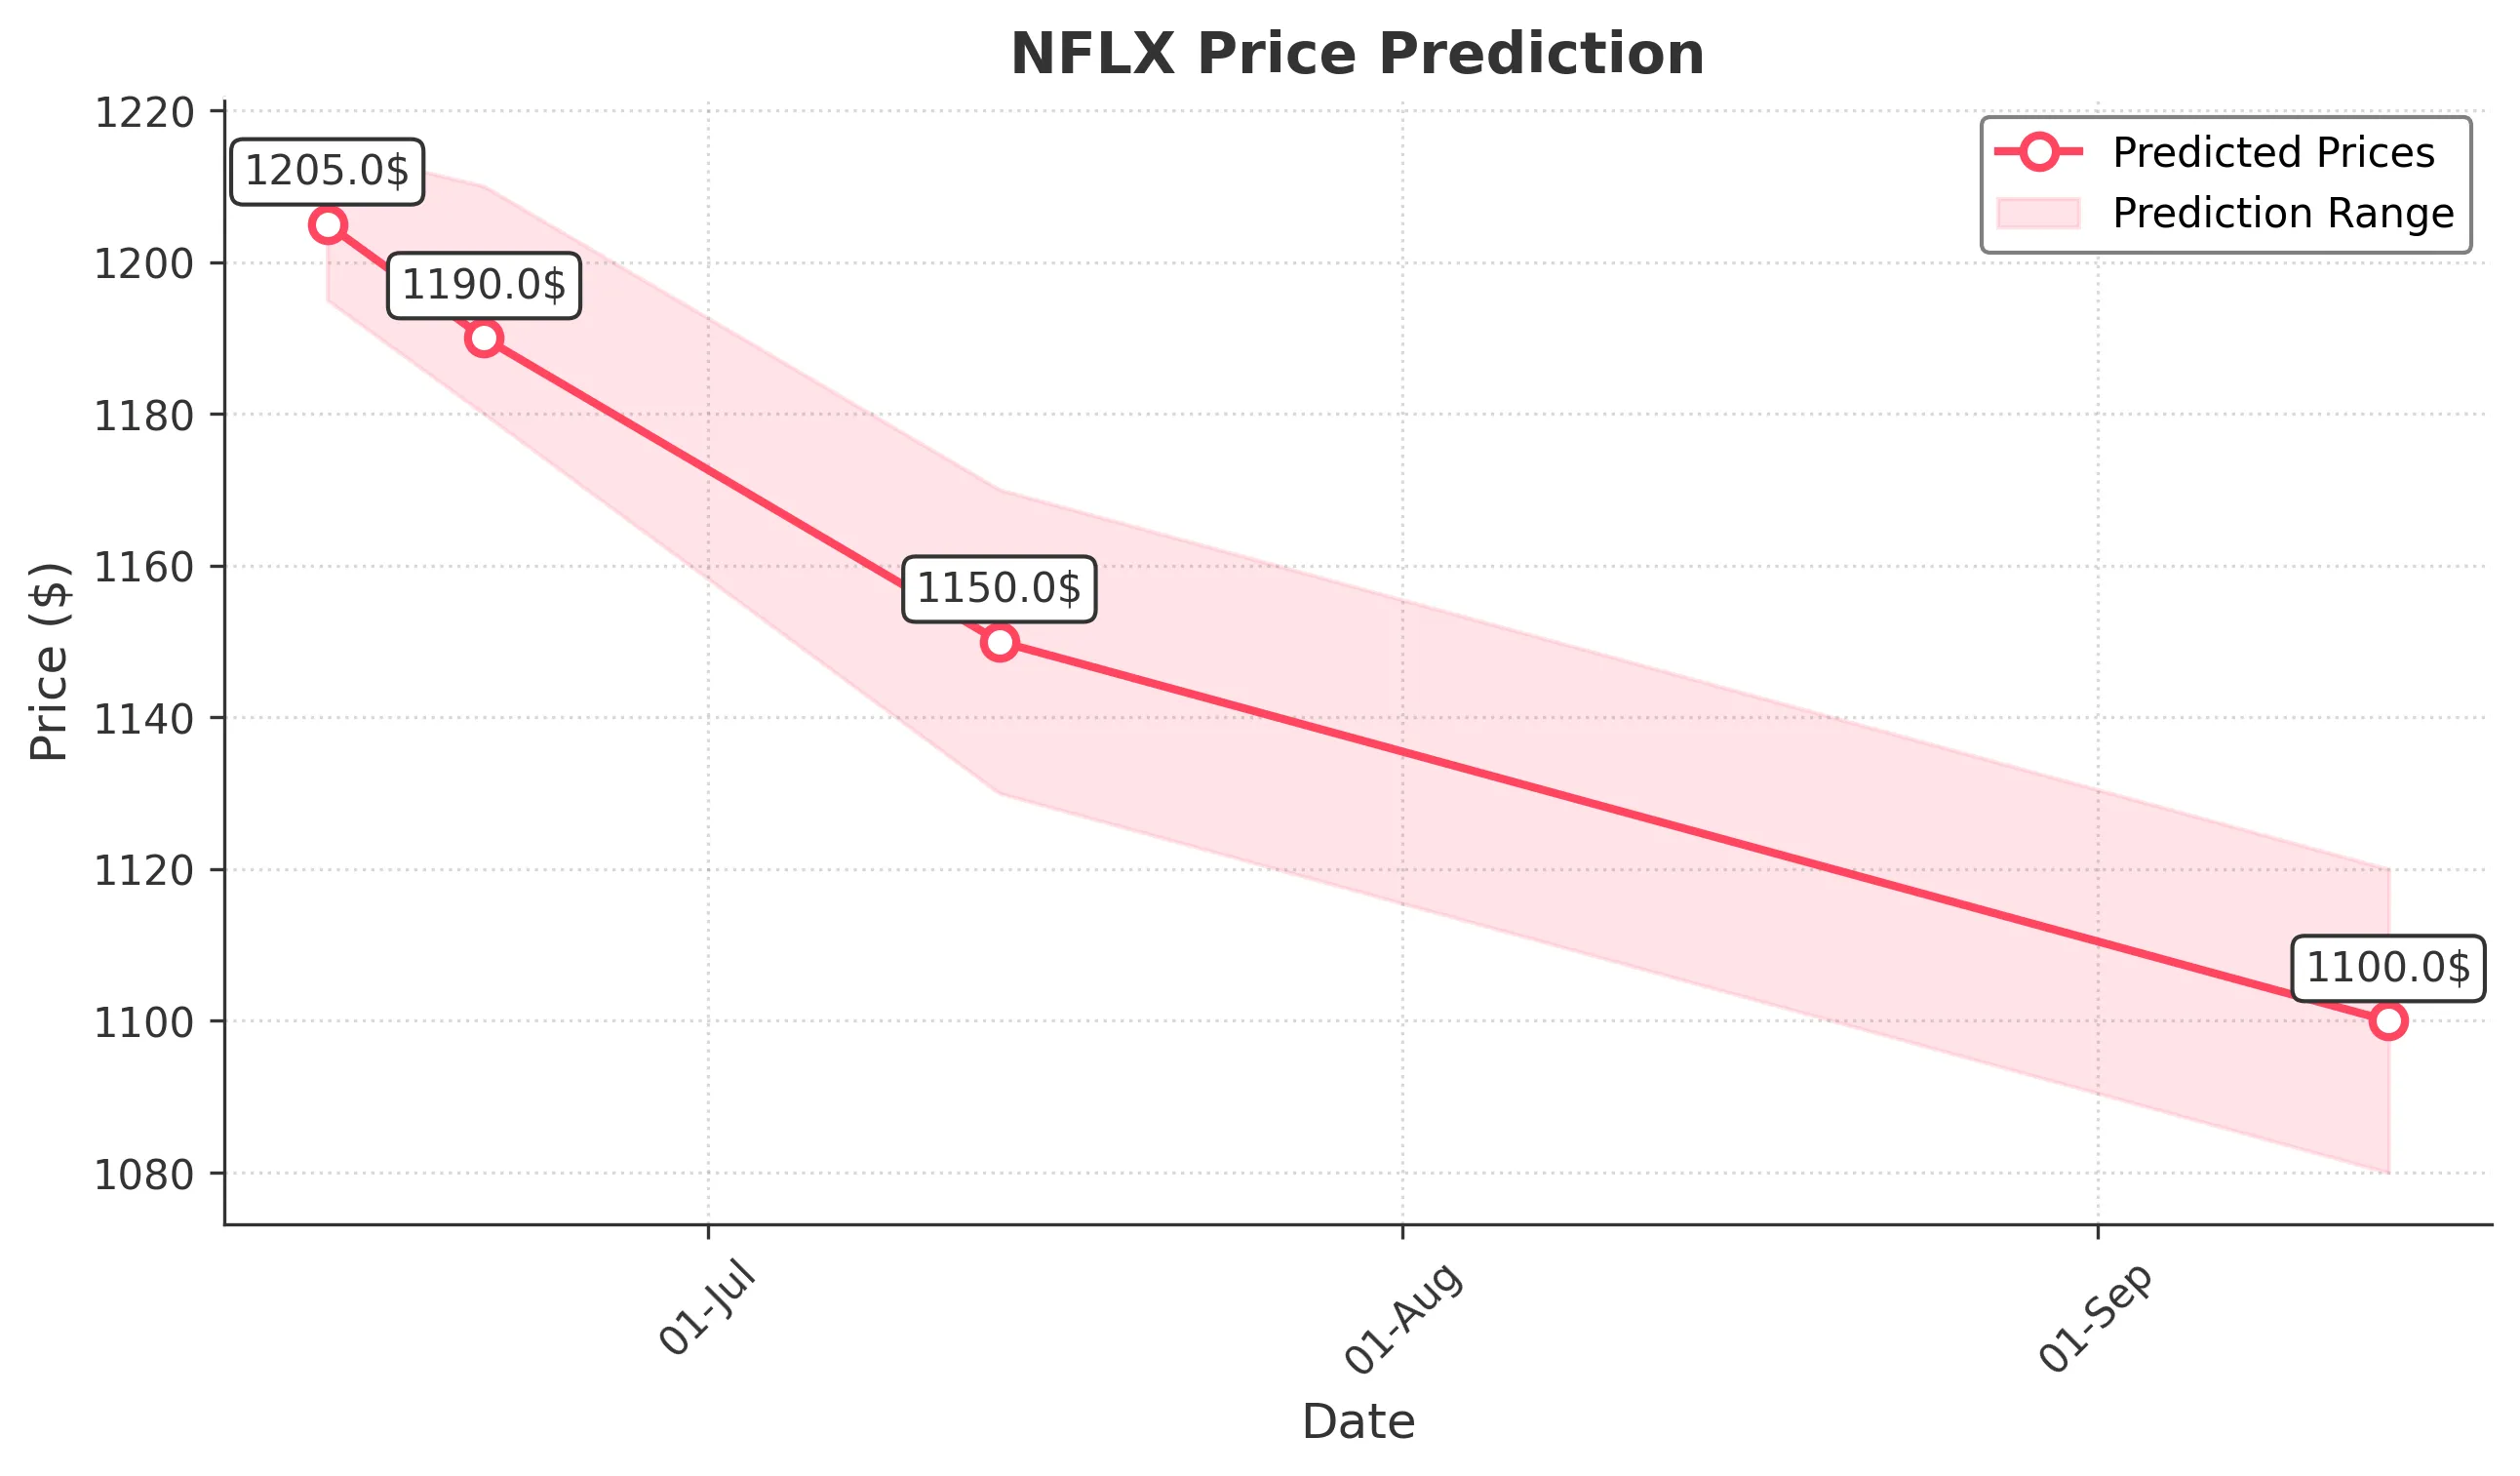
Target: June 14, 2025$1205
$1208
$1215
$1195
Description
The stock shows a slight bearish trend with a recent Doji candlestick indicating indecision. RSI is near 50, suggesting a potential pullback. Volume is decreasing, indicating weakening momentum. Expect a close around 1205.
Analysis
Over the past 3 months, NFLX has shown a bullish trend with significant upward movement. Key resistance at 1250 and support around 1200. Recent candlestick patterns suggest potential consolidation. Volume has been mixed, indicating uncertainty.
Confidence Level
Potential Risks
Market volatility and external news could impact the prediction. A sudden bullish sentiment could push prices higher.
1 Week Prediction
Target: June 21, 2025$1190
$1205
$1210
$1180
Description
Expect a slight decline as the stock faces resistance at 1215. The MACD shows a bearish crossover, and RSI is trending downwards. Volume may increase as traders react to market sentiment.
Analysis
The stock has been in a bullish phase but is showing signs of fatigue. Key support at 1180 is critical. Technical indicators suggest a possible pullback, with volume patterns indicating profit-taking.
Confidence Level
Potential Risks
Potential for unexpected news or earnings reports could alter the trend. Market sentiment remains a key factor.
1 Month Prediction
Target: July 14, 2025$1150
$1190
$1170
$1130
Description
A bearish outlook as the stock may continue to decline due to overbought conditions. The Bollinger Bands are tightening, indicating potential volatility. Expect a close around 1150 as selling pressure increases.
Analysis
NFLX has experienced significant volatility with a recent peak. The stock is facing resistance at 1200, and a correction seems likely. Volume analysis shows increased selling, indicating a potential downward trend.
Confidence Level
Potential Risks
Market conditions and macroeconomic factors could lead to unexpected price movements. Earnings reports may also influence the stock's direction.
3 Months Prediction
Target: September 14, 2025$1100
$1150
$1120
$1080
Description
Long-term bearish sentiment as the stock may continue to face downward pressure. Key support at 1100 is critical. The overall market sentiment and macroeconomic factors could lead to further declines.
Analysis
The stock has shown a strong bullish trend but is now facing resistance. Key support levels are being tested, and technical indicators suggest a potential reversal. Volume patterns indicate increased selling pressure.
Confidence Level
Potential Risks
Unforeseen market events or changes in investor sentiment could significantly impact the prediction. Earnings reports may also play a crucial role.