NFLX Trading Predictions
1 Day Prediction
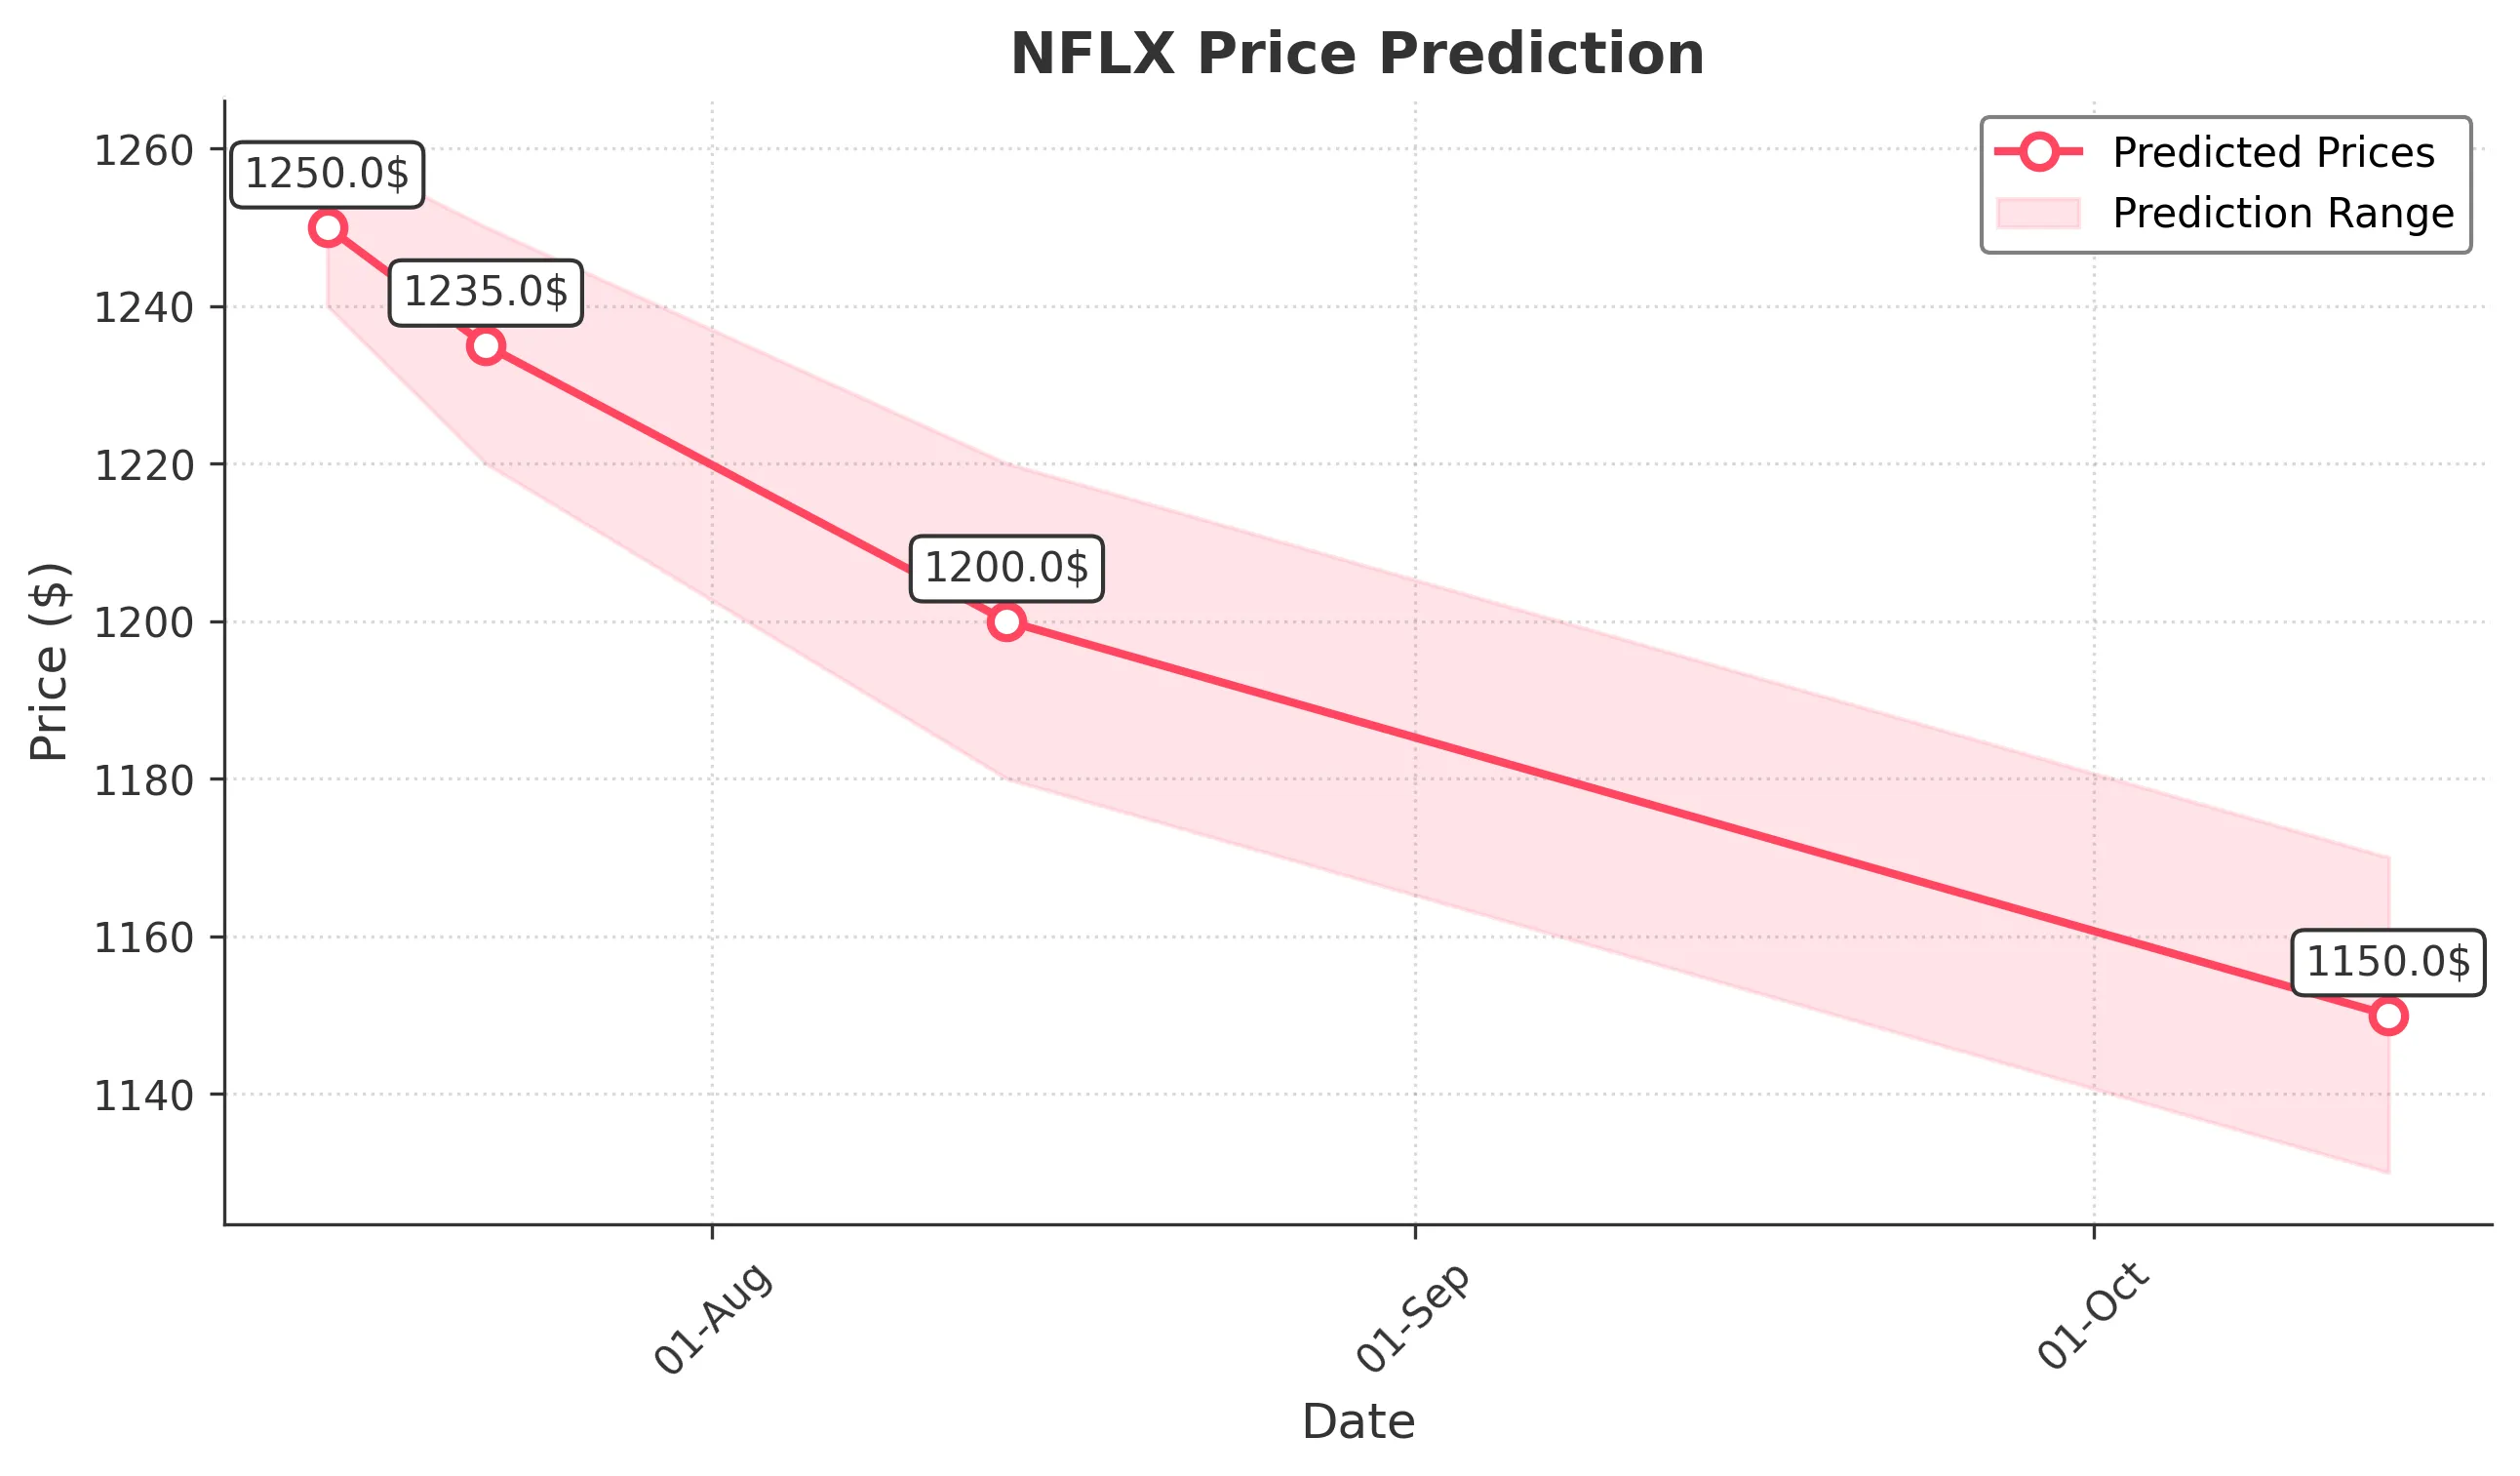
Target: July 15, 2025$1250
$1255
$1260
$1240
Description
The stock shows signs of a slight pullback after recent highs. RSI indicates overbought conditions, while MACD shows a bearish crossover. Expect a close around 1250 as profit-taking may occur.
Analysis
NFLX has been in a bullish trend but is showing signs of exhaustion. Key support at 1240 and resistance at 1260. Volume has been decreasing, indicating potential weakness.
Confidence Level
Potential Risks
Market volatility and external news could impact the price significantly.
1 Week Prediction
Target: July 22, 2025$1235
$1245
$1250
$1220
Description
A bearish trend is expected as the stock may continue to correct. The recent high volume on down days suggests selling pressure. Look for a close around 1235 as the market adjusts.
Analysis
The stock has shown a bearish divergence in the RSI. Support at 1220 is critical; a break below could lead to further declines. Overall sentiment is cautious.
Confidence Level
Potential Risks
Unforeseen macroeconomic events could lead to increased volatility.
1 Month Prediction
Target: August 14, 2025$1200
$1210
$1220
$1180
Description
Expect continued downward pressure as the stock may test lower support levels. The bearish trend is reinforced by MACD and RSI signals. A close around 1200 is likely.
Analysis
The stock has been in a corrective phase, with significant resistance at 1250. Volume patterns indicate a lack of buying interest. Key support at 1180 is crucial for the next month.
Confidence Level
Potential Risks
Market sentiment can shift rapidly, especially with earnings reports approaching.
3 Months Prediction
Target: October 14, 2025$1150
$1160
$1170
$1130
Description
Long-term bearish sentiment may prevail as the stock continues to face selling pressure. A close around 1150 is anticipated as the market adjusts to potential earnings misses.
Analysis
The stock has been trending downwards, with significant resistance at 1200. The overall market sentiment is bearish, and external factors could exacerbate the decline.
Confidence Level
Potential Risks
Economic conditions and competitive pressures could lead to unexpected price movements.