NFLX Trading Predictions
1 Day Prediction
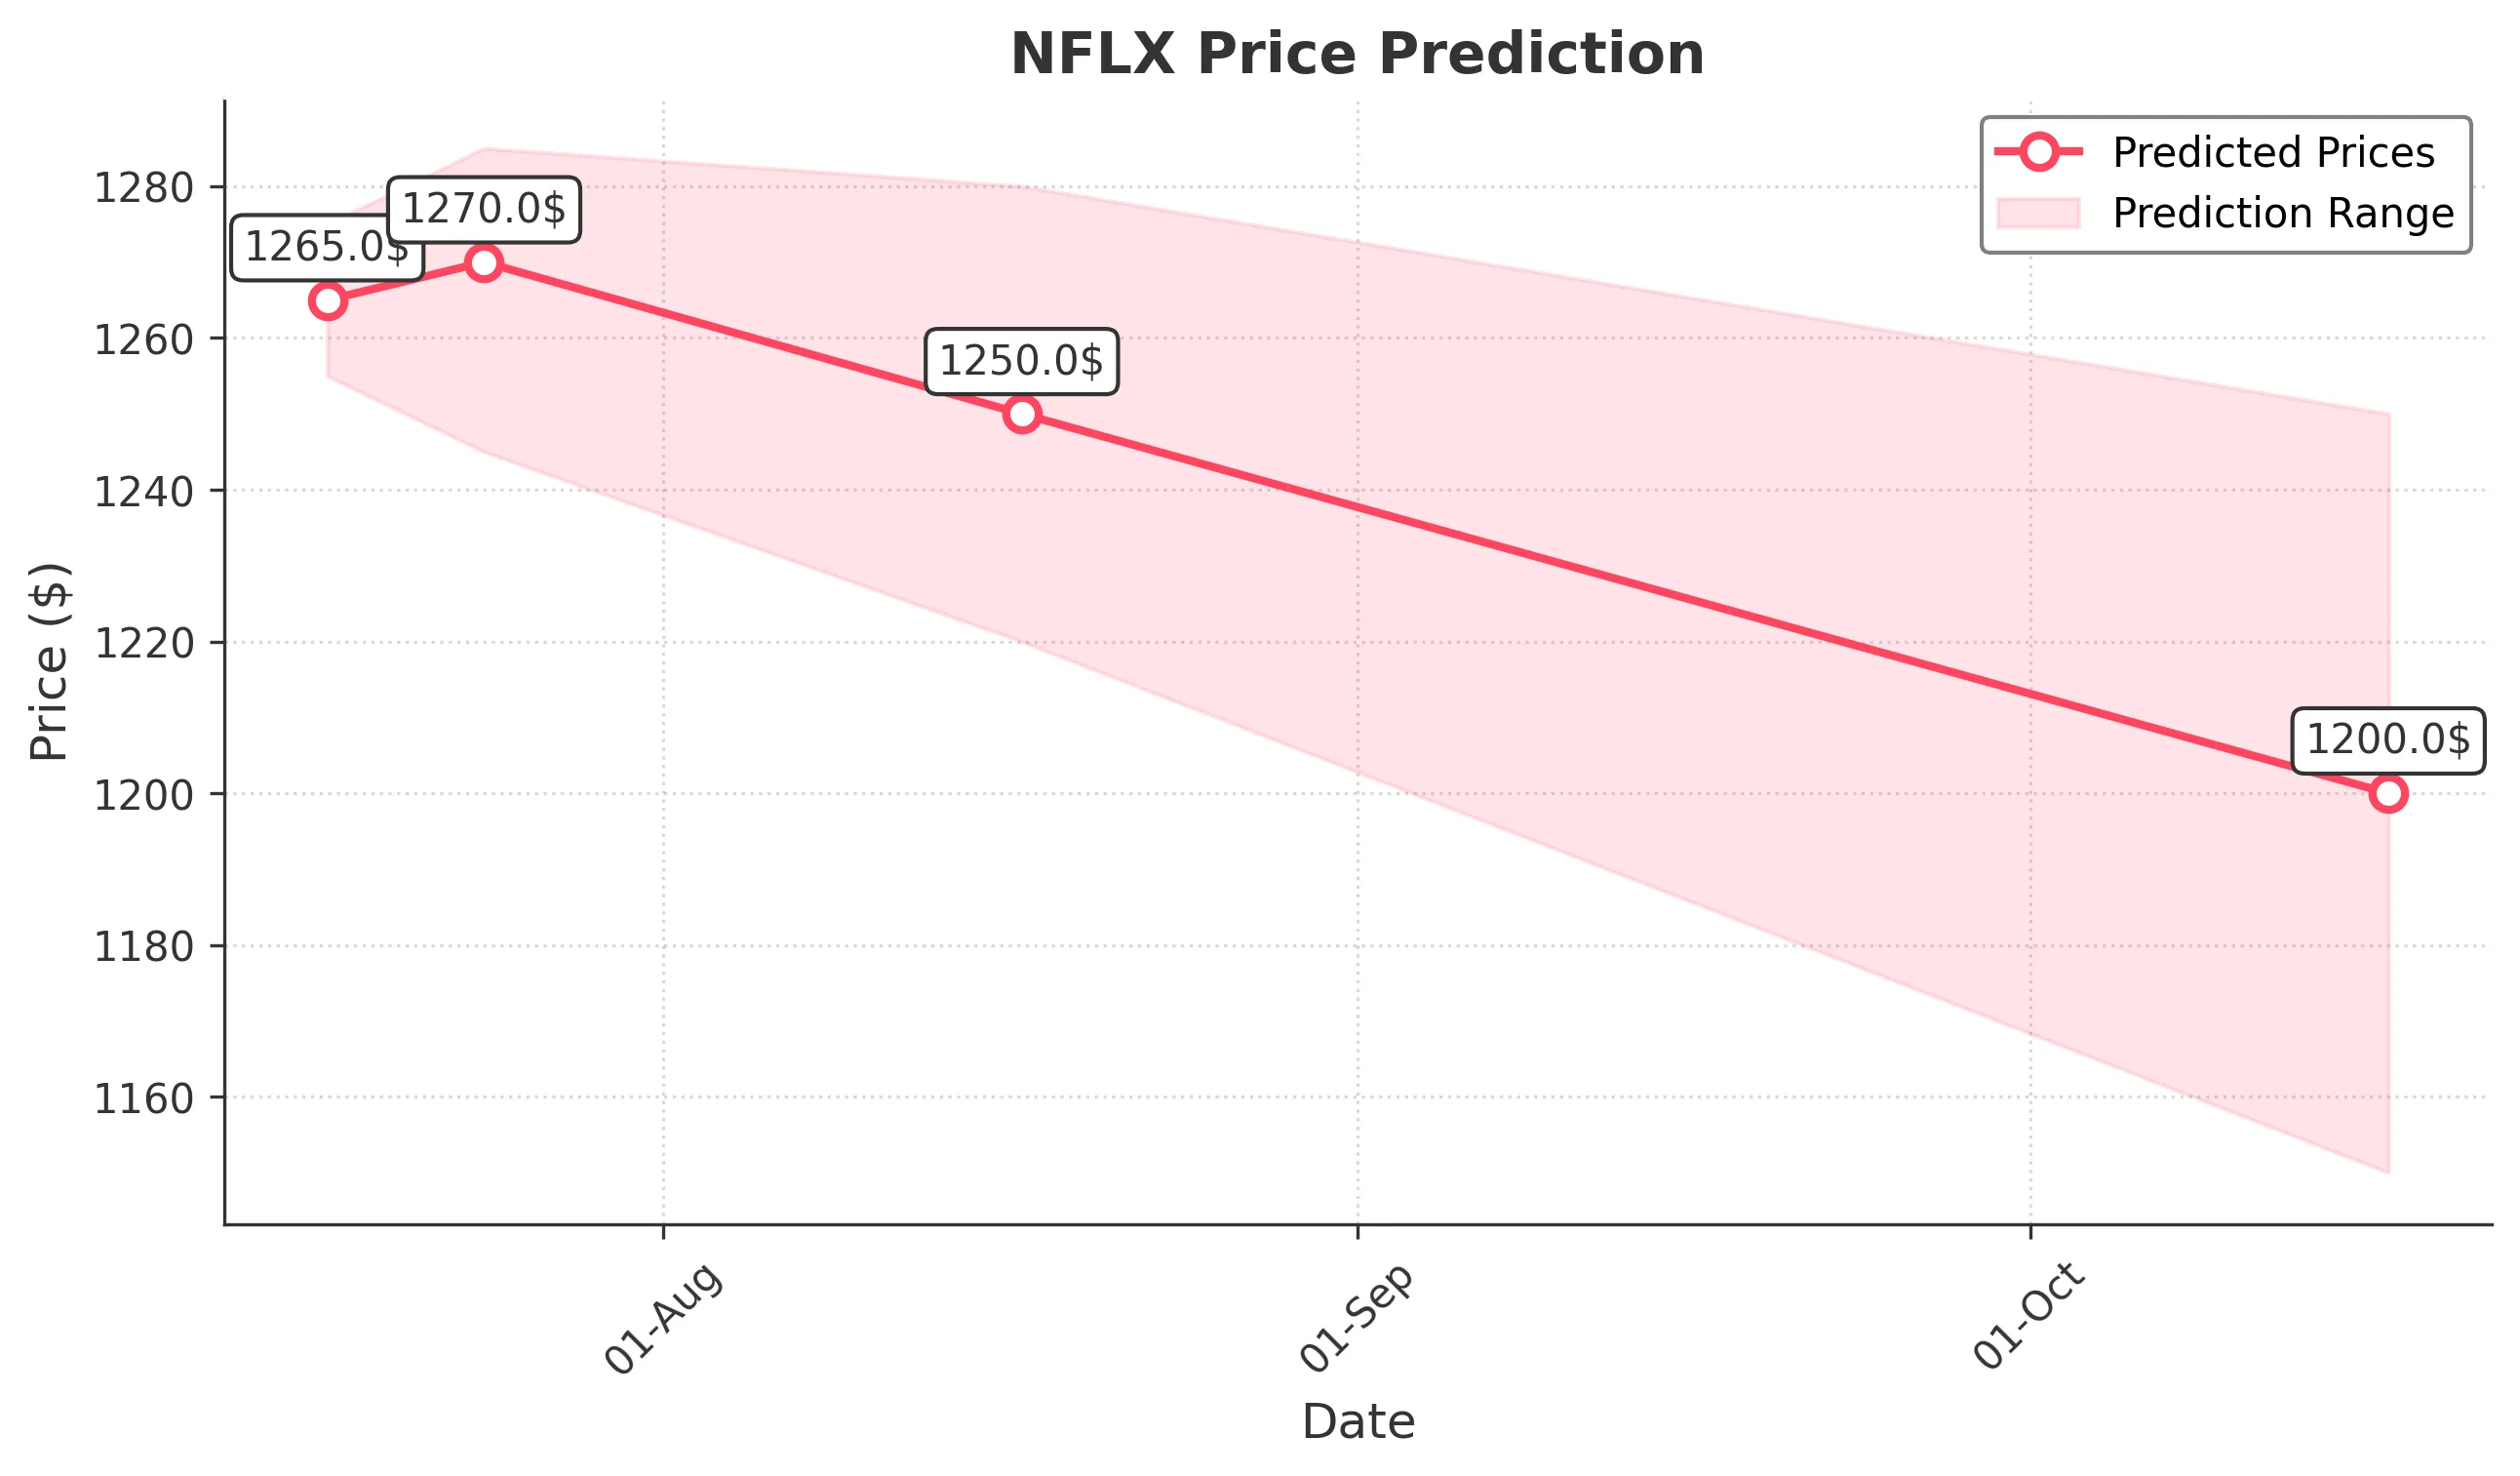
Target: July 17, 2025$1265
$1260
$1275
$1255
Description
The stock shows a slight bullish trend with a recent Doji candlestick indicating indecision. The RSI is neutral, suggesting potential for upward movement. However, the MACD is flattening, indicating possible consolidation. Volume is expected to be moderate.
Analysis
Over the past 3 months, NFLX has shown a bullish trend with significant upward movement, reaching a peak of 1339.13. Key support is at 1250, while resistance is around 1300. The RSI indicates overbought conditions, and recent volume spikes suggest profit-taking could occur.
Confidence Level
Potential Risks
Market volatility and external news could impact the price. A bearish reversal is possible if the support level at 1255 breaks.
1 Week Prediction
Target: July 24, 2025$1270
$1265
$1285
$1245
Description
The stock is expected to consolidate around current levels. The Bollinger Bands are tightening, indicating reduced volatility. The MACD shows a bearish crossover, suggesting potential downward pressure. Volume may increase as traders react to earnings reports.
Analysis
NFLX has experienced a strong rally but is now facing resistance. The recent price action shows signs of exhaustion, with the RSI nearing overbought territory. Volume has been mixed, indicating uncertainty among investors. Key support at 1250 remains critical.
Confidence Level
Potential Risks
Earnings announcements or macroeconomic data releases could lead to unexpected volatility. A break below 1245 could signal a bearish trend.
1 Month Prediction
Target: August 17, 2025$1250
$1270
$1280
$1220
Description
Expect a pullback as the stock approaches key resistance levels. The RSI indicates overbought conditions, and profit-taking may occur. The MACD divergence suggests weakening momentum. Volume is likely to increase as traders react to market sentiment.
Analysis
The stock has shown a strong upward trend but is now facing resistance. The recent price action indicates potential for a correction. Key support at 1220 is crucial, and if broken, further declines could occur. Market sentiment remains mixed.
Confidence Level
Potential Risks
Unforeseen market events or changes in investor sentiment could lead to significant price fluctuations. A strong earnings report could reverse the bearish sentiment.
3 Months Prediction
Target: October 17, 2025$1200
$1230
$1250
$1150
Description
Long-term outlook suggests a bearish trend as the stock may face continued selling pressure. The MACD indicates a bearish trend, and the RSI is likely to remain low. Volume may increase as investors react to broader market conditions.
Analysis
Over the past three months, NFLX has shown volatility with significant price swings. The stock is currently in a correction phase, and key support levels are being tested. Market sentiment is cautious, and external factors could heavily influence future performance.
Confidence Level
Potential Risks
Economic downturns or negative news could exacerbate declines. A failure to maintain support at 1150 could lead to further losses.