NFLX Trading Predictions
1 Day Prediction
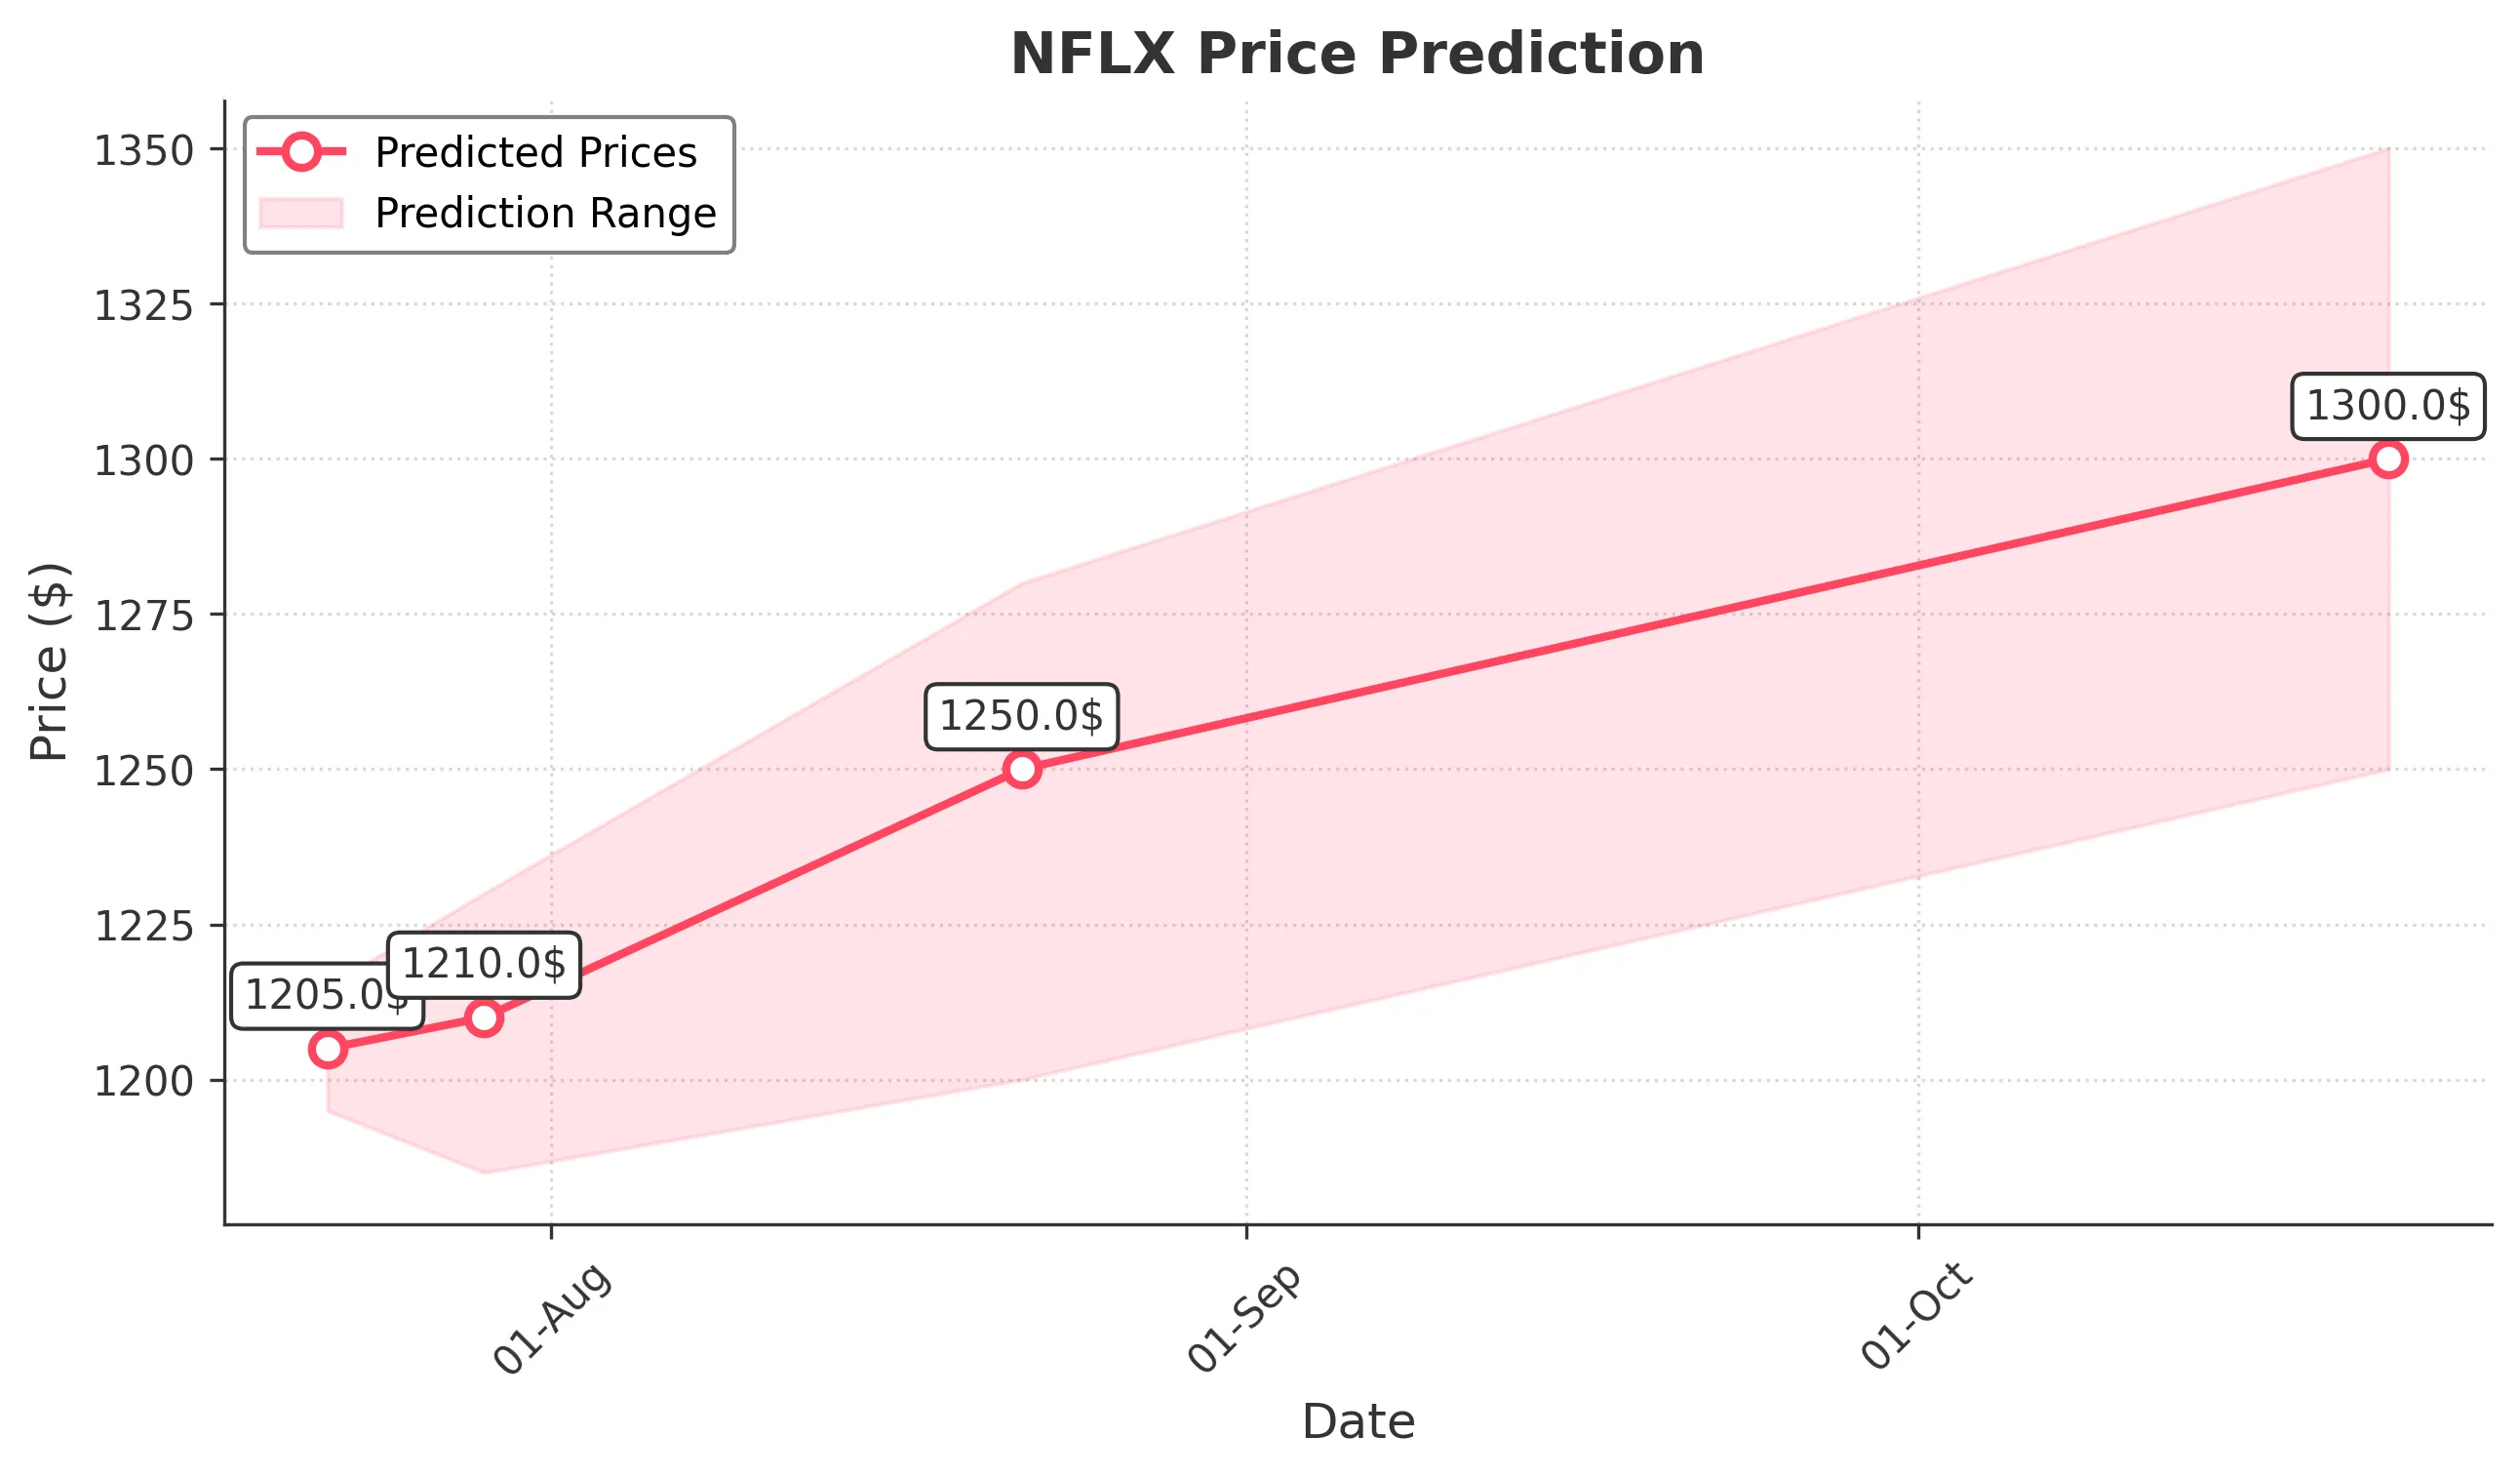
Target: July 22, 2025$1205
$1205
$1215
$1195
Description
The stock shows bearish momentum with a recent drop. RSI indicates oversold conditions, but a potential bounce could occur. Volume spikes suggest selling pressure. Expect a slight recovery but overall bearish sentiment.
Analysis
NFLX has shown a bearish trend recently, with significant drops in price. Key support is around 1200, while resistance is at 1250. The RSI is low, indicating potential for a bounce, but overall sentiment remains cautious.
Confidence Level
Potential Risks
Market volatility and external news could impact the prediction. A reversal is possible if bullish sentiment returns.
1 Week Prediction
Target: July 29, 2025$1210
$1210
$1230
$1185
Description
Expect a slight recovery as the stock may find support at 1200. However, bearish trends persist. Watch for volume spikes that could indicate a reversal. Overall, cautious optimism.
Analysis
The stock has been in a downtrend, with recent lows indicating weakness. Support at 1200 is critical, while resistance is at 1250. Volume analysis shows increased selling, and the MACD is bearish.
Confidence Level
Potential Risks
Unforeseen market events or earnings reports could lead to volatility. The bearish trend may continue if selling pressure remains.
1 Month Prediction
Target: August 22, 2025$1250
$1250
$1280
$1200
Description
A potential recovery is anticipated as the stock may stabilize around 1250. Technical indicators suggest a possible reversal, but caution is advised due to recent bearish trends.
Analysis
The stock has been volatile, with significant fluctuations. Key support at 1200 and resistance at 1280 are critical. The RSI is neutral, indicating indecision in the market.
Confidence Level
Potential Risks
Market sentiment and external factors could hinder recovery. A failure to break above resistance at 1280 may lead to further declines.
3 Months Prediction
Target: October 22, 2025$1300
$1300
$1350
$1250
Description
If the stock can break through resistance levels, a gradual recovery to 1300 is possible. However, macroeconomic factors and market sentiment will play a significant role.
Analysis
The stock's performance has been mixed, with recent bearish trends. Key resistance at 1350 and support at 1250 are crucial. The market's overall sentiment remains cautious, influenced by broader economic factors.
Confidence Level
Potential Risks
Economic conditions and competitive pressures could impact performance. A bearish trend could resume if market sentiment shifts negatively.