NFLX Trading Predictions
1 Day Prediction
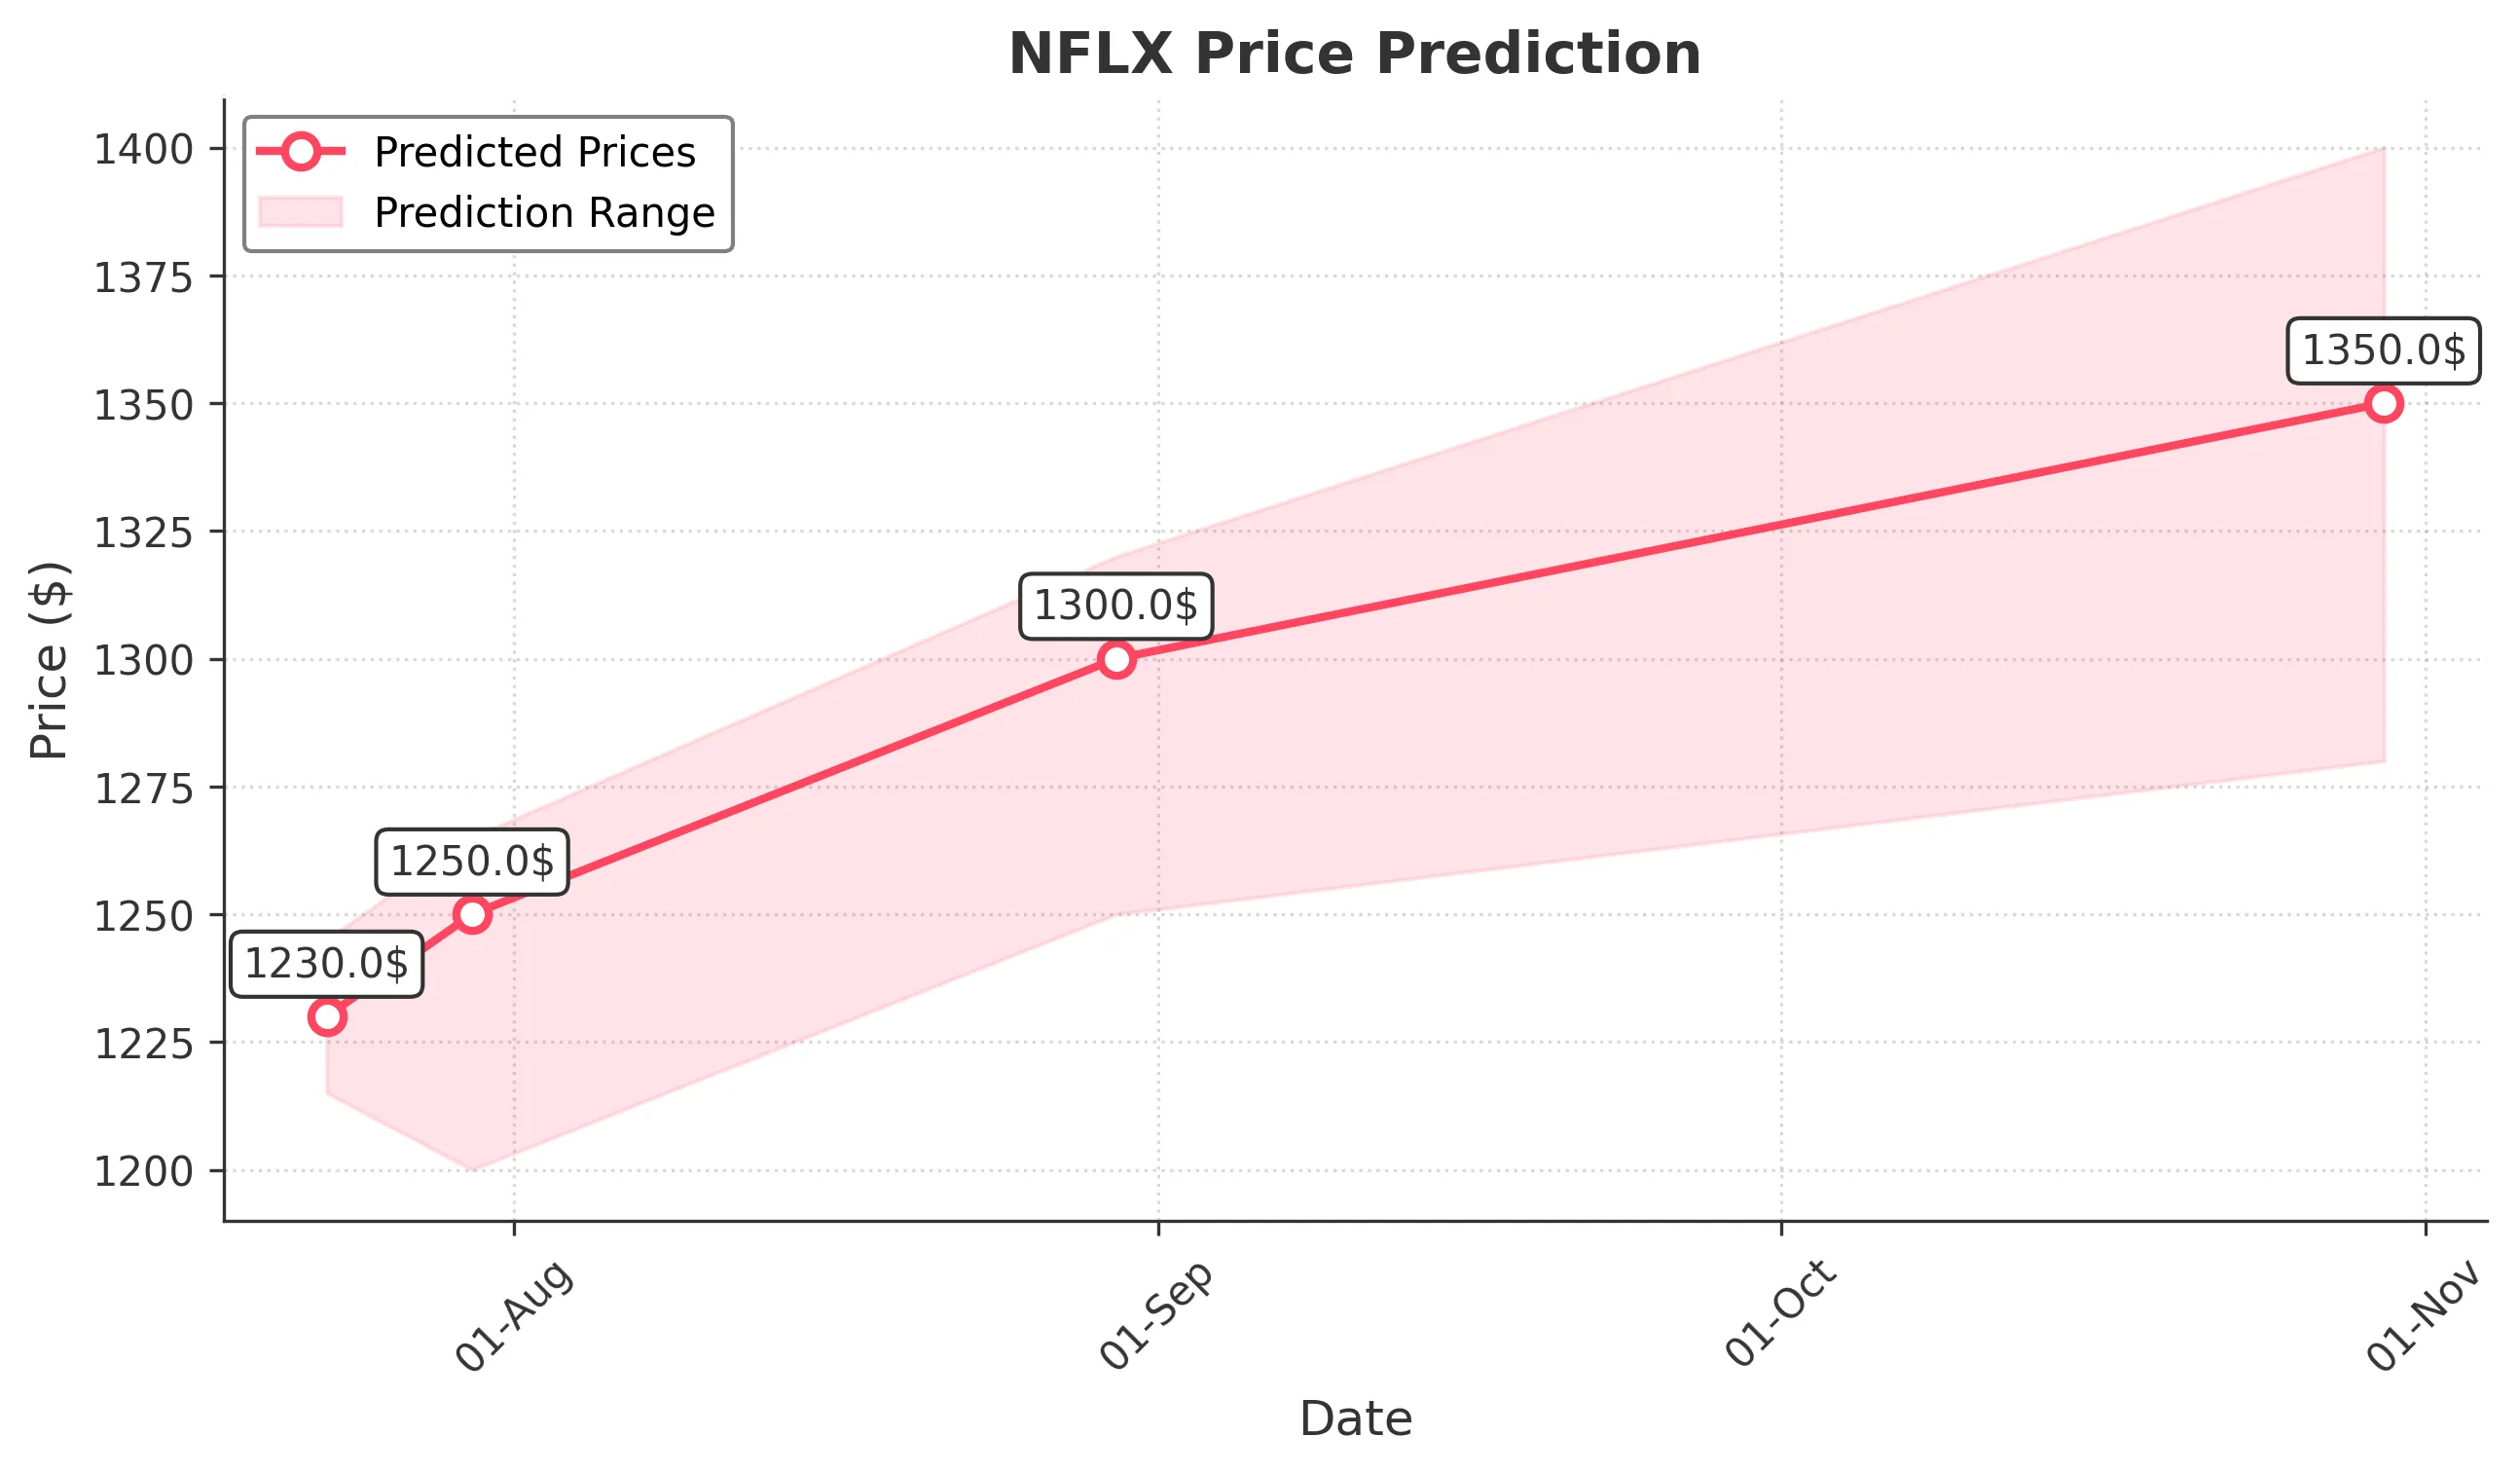
Target: July 23, 2025$1230
$1225
$1245
$1215
Description
The stock shows a slight bullish trend with a potential bounce from recent support around 1215. The RSI is neutral, and MACD indicates a possible upward momentum. However, recent volatility suggests caution.
Analysis
Over the past 3 months, NFLX has shown a bearish trend recently after reaching highs above 1300. Key support is around 1215, while resistance is near 1250. Volume has been inconsistent, indicating uncertainty. Technical indicators show mixed signals.
Confidence Level
Potential Risks
Market sentiment could shift due to external news or earnings reports, which may impact the stock's performance.
1 Week Prediction
Target: July 30, 2025$1250
$1235
$1265
$1200
Description
Expect a recovery towards 1250 as the stock may find support at 1200. The MACD is showing signs of a bullish crossover, and the RSI is approaching oversold territory, indicating potential upward movement.
Analysis
The stock has been volatile, with recent declines from highs. Support at 1200 is critical, while resistance at 1265 may limit upward movement. Technical indicators suggest a possible rebound, but external factors could influence outcomes.
Confidence Level
Potential Risks
Potential market corrections or negative news could reverse this trend, impacting the predicted price.
1 Month Prediction
Target: August 30, 2025$1300
$1280
$1320
$1250
Description
A gradual recovery is anticipated as the stock stabilizes around 1300. The bullish divergence in RSI and MACD supports this outlook, but market sentiment remains a concern.
Analysis
NFLX has faced significant fluctuations, with a recent bearish trend. Key resistance at 1320 and support at 1250 are crucial. Technical indicators suggest a potential recovery, but external market conditions could pose risks.
Confidence Level
Potential Risks
Economic conditions and competitive pressures could hinder recovery, leading to potential price declines.
3 Months Prediction
Target: October 30, 2025$1350
$1320
$1400
$1280
Description
Long-term outlook suggests a return to 1350 as the stock stabilizes. Positive earnings reports and market recovery could drive this trend, but caution is advised due to potential volatility.
Analysis
The stock has shown a bearish trend recently, with significant resistance at 1400. Support levels are critical around 1280. Technical indicators are mixed, suggesting potential for recovery, but external factors could lead to further declines.
Confidence Level
Potential Risks
Unforeseen market events or changes in consumer behavior could significantly impact the stock's trajectory.