NFLX Trading Predictions
1 Day Prediction
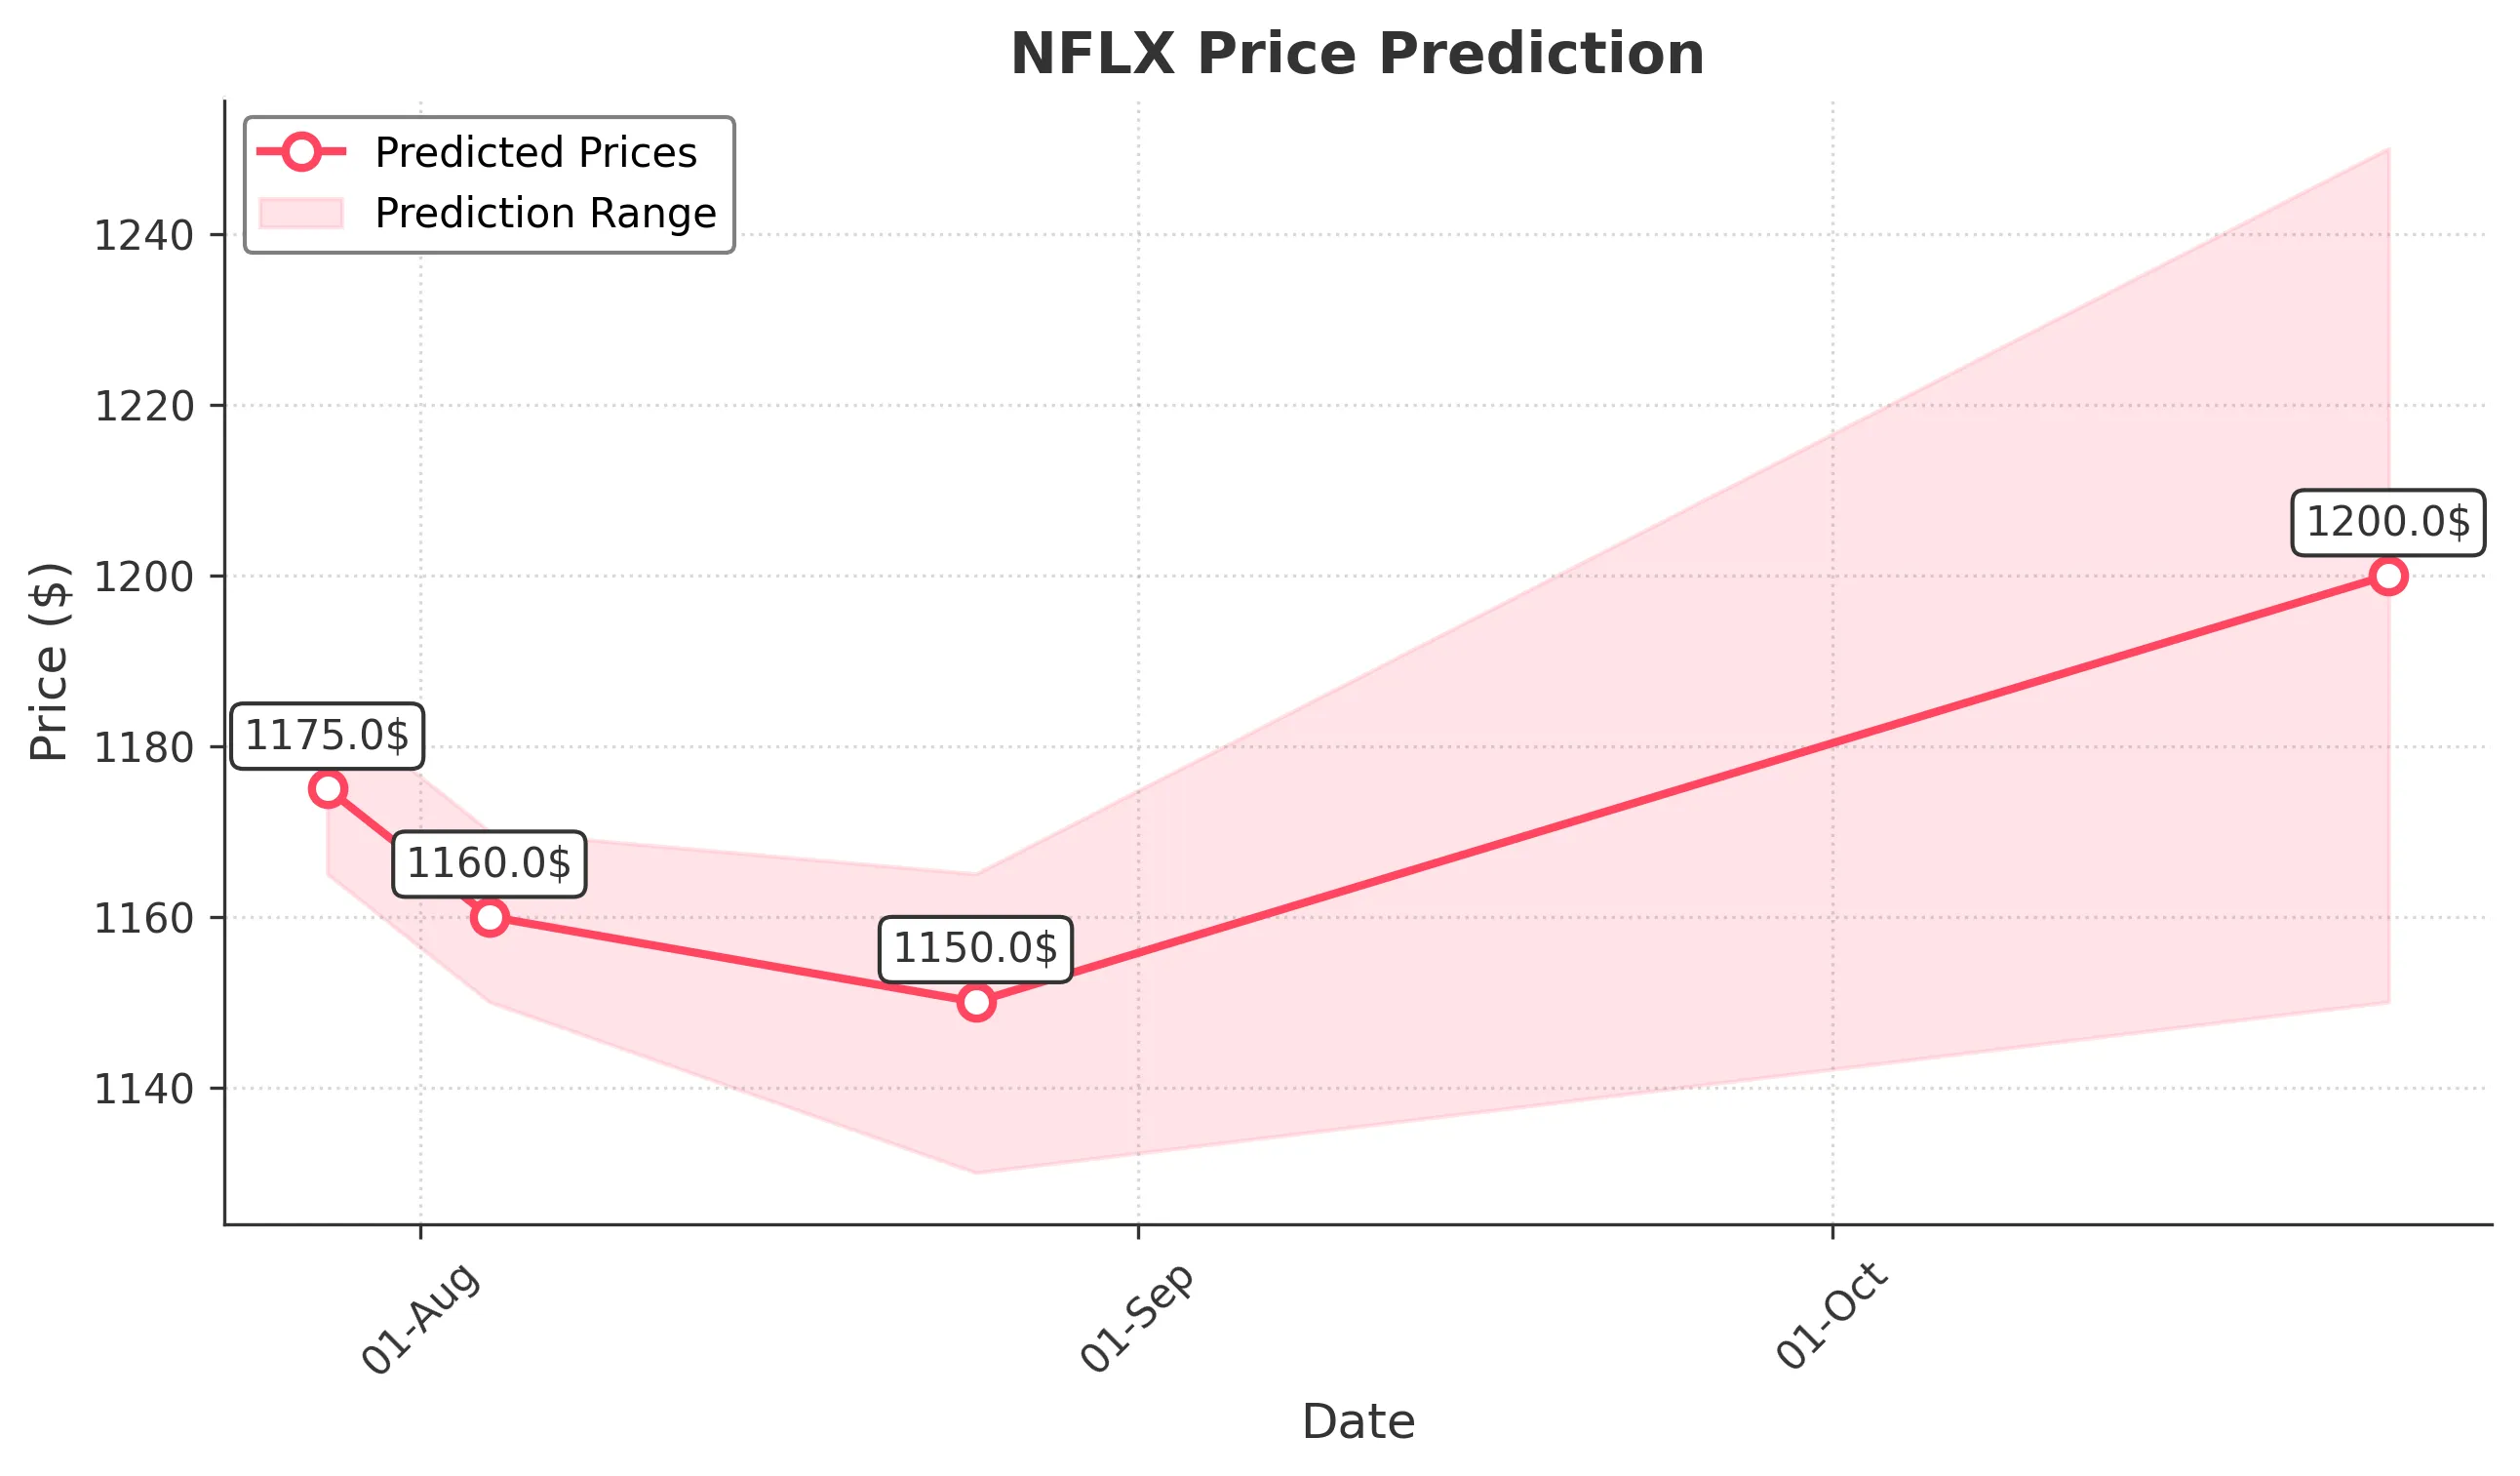
Target: July 28, 2025$1175
$1170
$1185
$1165
Description
The stock shows a bearish trend with recent lower highs and lower lows. RSI indicates oversold conditions, suggesting a potential bounce. However, the recent volume spike on July 18 indicates selling pressure, which may continue to weigh on prices.
Analysis
Over the past 3 months, NFLX has experienced significant volatility, with a peak around $1339 and a recent drop to $1177. Key support is at $1170, while resistance is at $1200. The MACD shows bearish momentum, and the ATR indicates increased volatility.
Confidence Level
Potential Risks
Market volatility and potential news could impact the stock's performance. A reversal pattern could emerge if bullish sentiment returns.
1 Week Prediction
Target: August 4, 2025$1160
$1165
$1170
$1150
Description
The bearish trend is expected to persist as the stock struggles to regain upward momentum. The recent candlestick patterns suggest continued selling pressure, and the RSI remains in a neutral zone, indicating indecision among traders.
Analysis
NFLX has shown a bearish trend with significant selling pressure. The stock has tested support levels around $1170 multiple times. The MACD is bearish, and volume has been inconsistent, indicating uncertainty in market sentiment.
Confidence Level
Potential Risks
Unforeseen macroeconomic events or earnings reports could lead to sudden price movements. A bullish reversal is possible if sentiment shifts.
1 Month Prediction
Target: August 25, 2025$1150
$1155
$1165
$1130
Description
The stock is likely to continue its downward trajectory as bearish sentiment prevails. The Bollinger Bands indicate a squeeze, suggesting potential volatility, but the overall trend remains negative.
Analysis
In the last three months, NFLX has faced significant resistance at higher levels. The stock's performance has been characterized by high volatility and bearish momentum, with key support at $1130. The RSI indicates potential oversold conditions, but the overall trend remains bearish.
Confidence Level
Potential Risks
Market sentiment can change rapidly, and any positive news could lead to a reversal. The potential for a bullish divergence exists if buying pressure increases.
3 Months Prediction
Target: October 25, 2025$1200
$1180
$1250
$1150
Description
A potential recovery could occur as the stock approaches key support levels. If bullish sentiment returns, we may see a reversal. However, the overall trend remains uncertain, and external factors could influence price movements.
Analysis
NFLX's performance over the past three months has been marked by volatility and bearish trends. The stock has tested key support levels, and while there is potential for recovery, the overall market sentiment remains cautious. The MACD and RSI suggest a need for careful monitoring.
Confidence Level
Potential Risks
Economic conditions and company performance will heavily influence the stock's trajectory. A lack of positive catalysts could hinder recovery.