NFLX Trading Predictions
1 Day Prediction
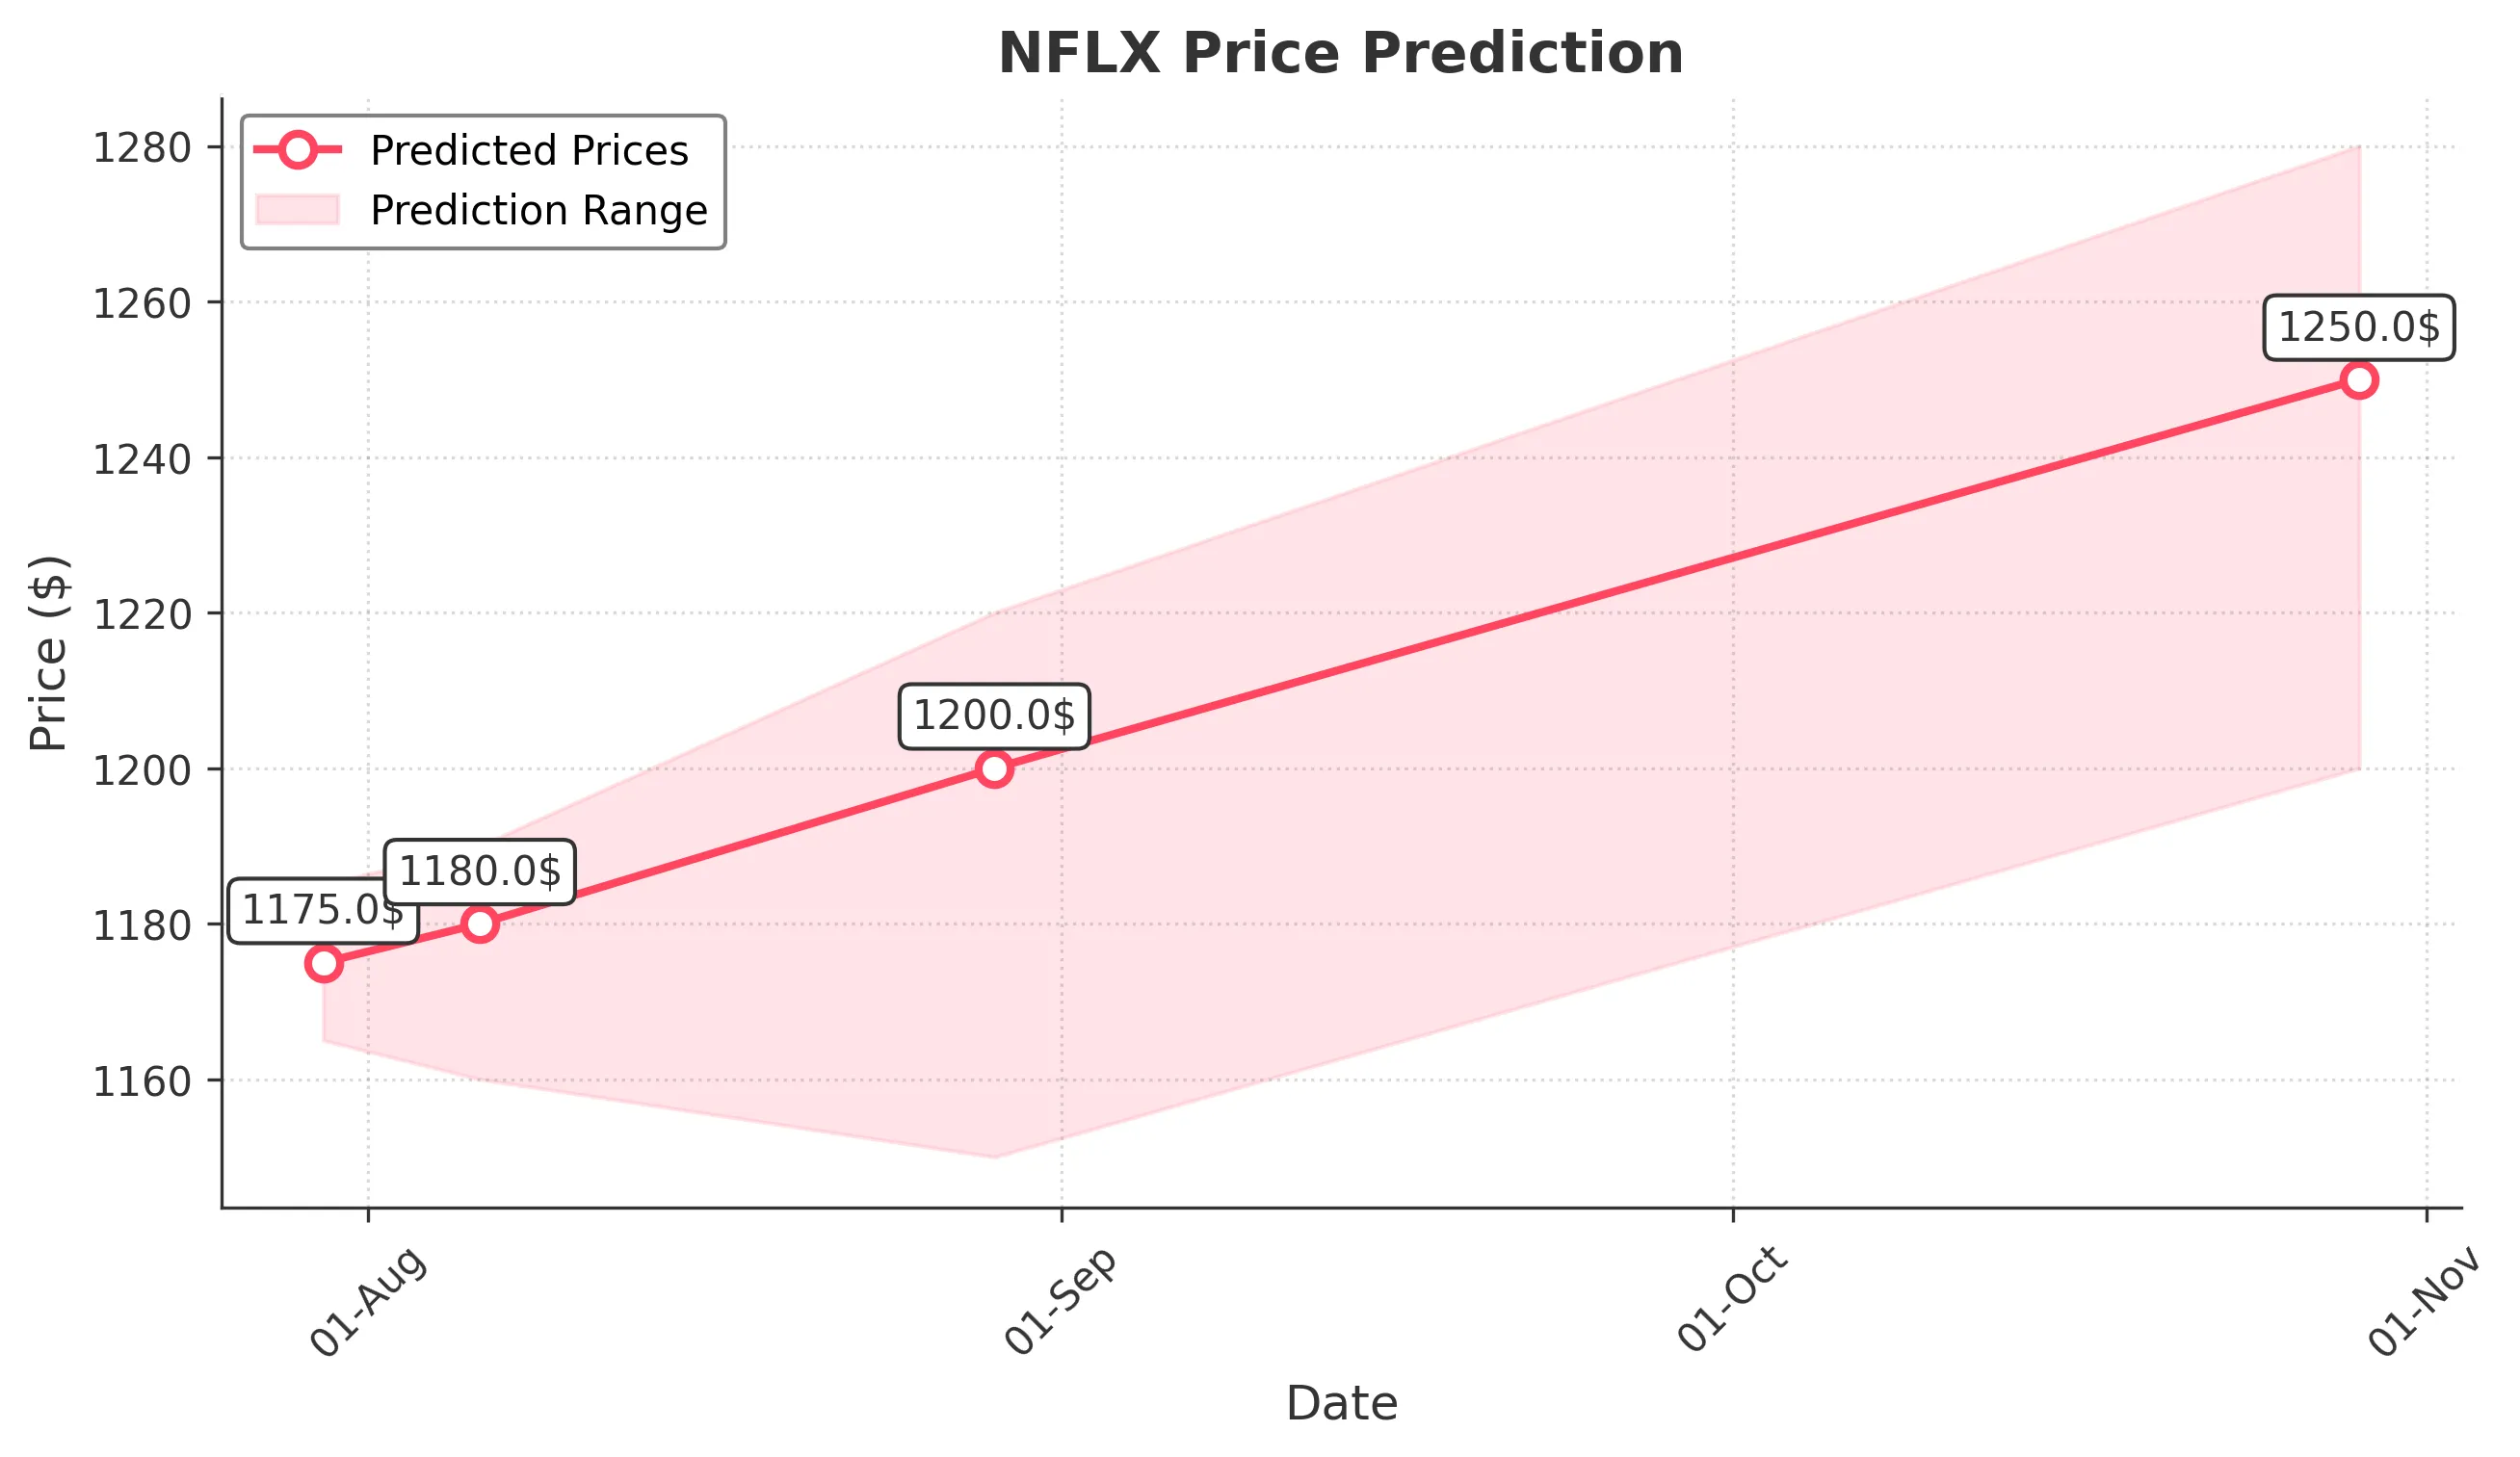
Target: July 30, 2025$1175
$1172
$1185
$1165
Description
The stock shows a slight bearish trend with recent lower highs and lower lows. RSI indicates oversold conditions, suggesting a potential bounce. However, the recent volume spike on July 18 indicates selling pressure, which may continue to affect prices.
Analysis
Over the past 3 months, NFLX has experienced significant volatility, with a peak around $1339. The recent trend has been bearish, with support at $1170. Technical indicators like MACD are showing bearish divergence, while Bollinger Bands suggest potential for a bounce.
Confidence Level
Potential Risks
Market volatility and external news could impact the prediction. A reversal pattern could emerge if bullish sentiment returns.
1 Week Prediction
Target: August 6, 2025$1180
$1175
$1190
$1160
Description
The stock may stabilize around $1180 as it approaches a key support level. The RSI is recovering from oversold territory, indicating potential for a short-term rally. However, bearish sentiment remains prevalent, which could cap gains.
Analysis
NFLX has shown a bearish trend recently, with significant selling pressure. The stock is currently testing support levels around $1170. Moving averages indicate a potential crossover, which could signal a reversal if bullish momentum builds.
Confidence Level
Potential Risks
Unforeseen macroeconomic events or earnings reports could lead to increased volatility, impacting the accuracy of this prediction.
1 Month Prediction
Target: August 29, 2025$1200
$1185
$1220
$1150
Description
A potential recovery towards $1200 is anticipated as the stock may find support at lower levels. The RSI is expected to stabilize, and if bullish sentiment returns, it could push prices higher. However, resistance at $1220 may limit upside.
Analysis
The stock has been in a bearish phase, but signs of stabilization are emerging. Key support at $1170 and resistance at $1220 are critical levels to watch. Volume patterns suggest potential accumulation, but caution is warranted due to overall market conditions.
Confidence Level
Potential Risks
Market sentiment can shift rapidly, and external factors such as earnings or economic data releases could lead to unexpected price movements.
3 Months Prediction
Target: October 29, 2025$1250
$1230
$1280
$1200
Description
If the stock can break above resistance levels, a gradual recovery towards $1250 is possible. The market may react positively to upcoming earnings, but caution is advised as macroeconomic factors could influence performance.
Analysis
NFLX has shown significant volatility, with a bearish trend recently. However, if it can hold above key support levels, there is potential for a recovery. Technical indicators suggest a possible bullish reversal, but external factors must be monitored closely.
Confidence Level
Potential Risks
Potential for market corrections or negative news could derail the recovery. The overall economic environment remains uncertain.