NFLX Trading Predictions
1 Day Prediction
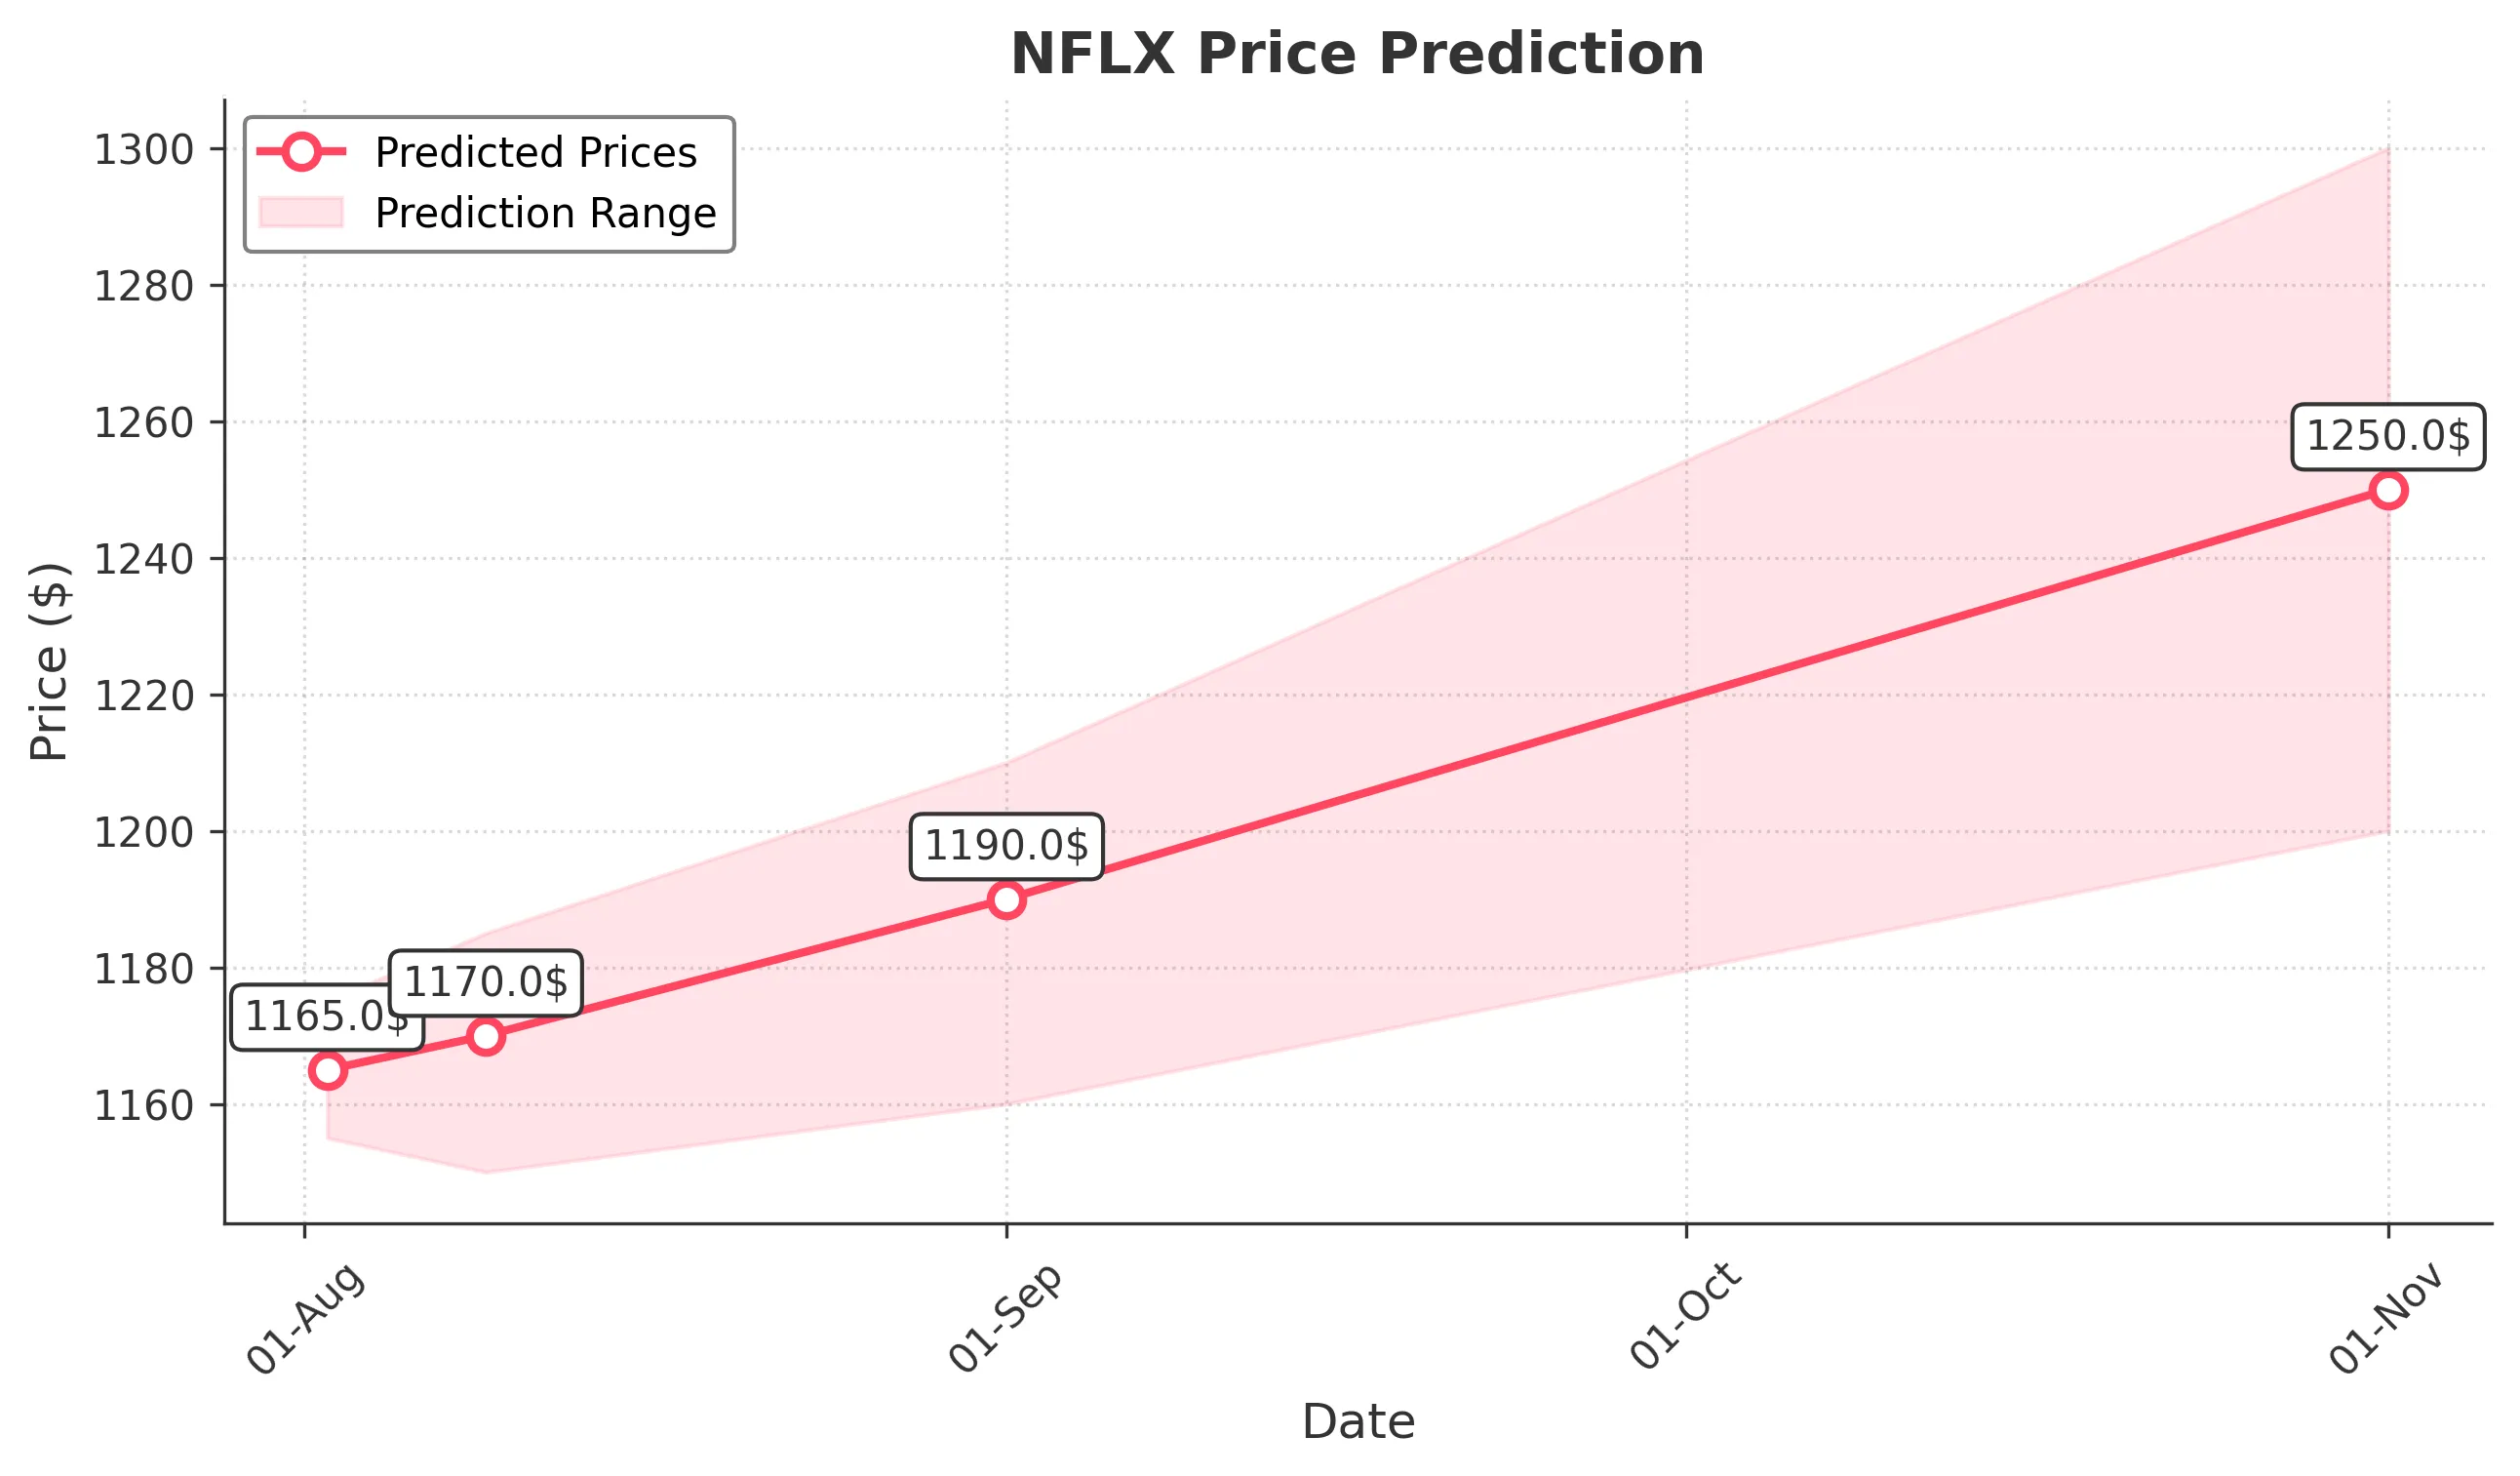
Target: August 2, 2025$1165
$1160
$1175
$1155
Description
The stock shows a slight bullish trend with a recent Doji candlestick indicating indecision. RSI is neutral, and MACD is close to crossing above the signal line, suggesting potential upward momentum. However, recent volatility may limit gains.
Analysis
Over the past 3 months, NFLX has shown a bearish trend with significant fluctuations. Key support at 1150 and resistance at 1200. Volume spikes on down days indicate selling pressure. Technical indicators suggest a potential reversal, but caution is warranted.
Confidence Level
Potential Risks
Market sentiment could shift due to external news or earnings reports, which may impact the stock's performance.
1 Week Prediction
Target: August 9, 2025$1170
$1165
$1185
$1150
Description
The stock may experience a slight recovery as it approaches key Fibonacci retracement levels. The MACD shows potential bullish divergence, but the RSI indicates overbought conditions, suggesting caution in the short term.
Analysis
NFLX has been volatile, with a recent bearish phase. Support at 1150 is critical, while resistance at 1200 remains strong. Technical indicators show mixed signals, with volume patterns indicating uncertainty. External factors could heavily influence price movements.
Confidence Level
Potential Risks
Potential market corrections or negative news could reverse the upward trend, impacting the prediction.
1 Month Prediction
Target: September 1, 2025$1190
$1175
$1210
$1160
Description
A gradual recovery is expected as the stock approaches the 50-day moving average. The RSI is expected to stabilize, and MACD may confirm a bullish trend. However, market sentiment remains cautious due to recent volatility.
Analysis
The past 3 months show a bearish trend with significant price swings. Key support at 1150 and resistance at 1200. Volume analysis indicates selling pressure, but potential bullish signals from technical indicators suggest a possible recovery.
Confidence Level
Potential Risks
Unforeseen macroeconomic events or earnings reports could disrupt the anticipated recovery.
3 Months Prediction
Target: November 1, 2025$1250
$1230
$1300
$1200
Description
Long-term bullish sentiment may prevail as the stock approaches key resistance levels. Positive earnings reports and market sentiment could drive prices higher, but caution is advised due to potential market corrections.
Analysis
NFLX has shown significant volatility with a bearish trend recently. Key support at 1150 and resistance at 1300. Technical indicators suggest potential recovery, but external factors and market sentiment will play a crucial role in future performance.
Confidence Level
Potential Risks
Market volatility and external economic factors could impact the stock's performance, leading to potential price corrections.