NFLX Trading Predictions
1 Day Prediction
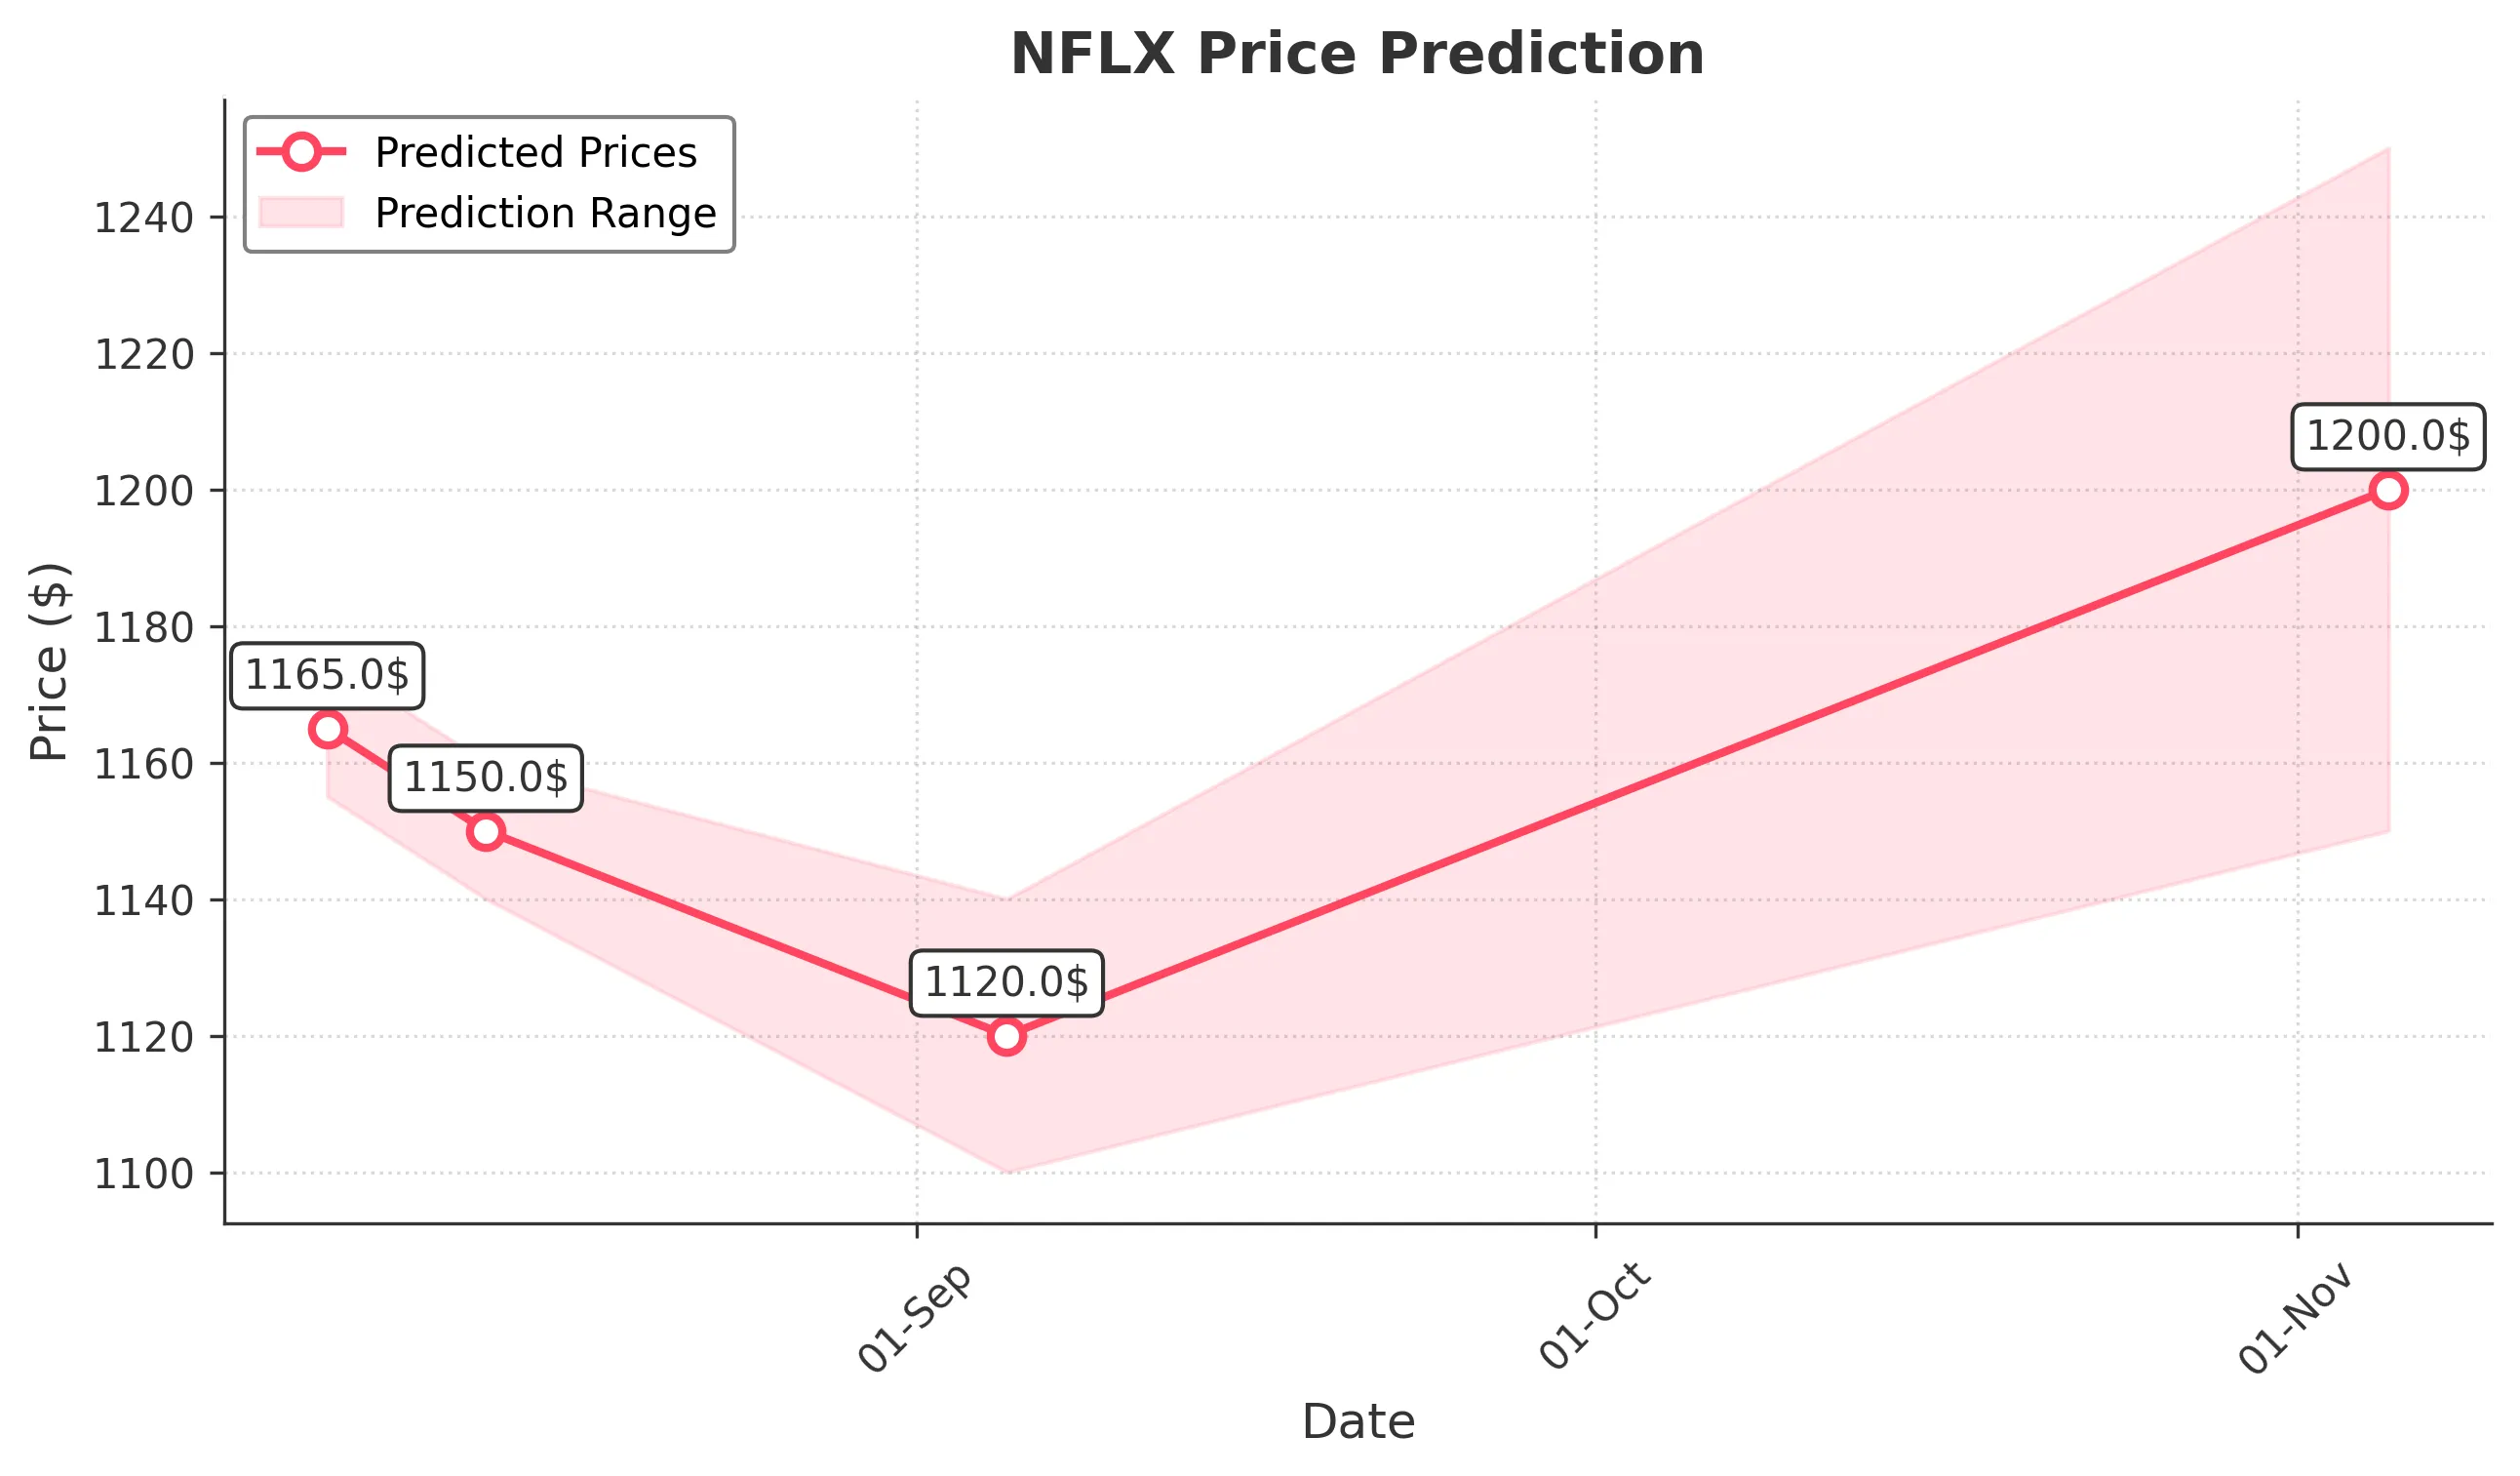
Target: August 6, 2025$1165
$1165
$1175
$1155
Description
The stock shows a slight bearish trend with recent lower closes. RSI indicates overbought conditions, suggesting a potential pullback. Volume has decreased, indicating weakening momentum. Expect a close around 1165.
Analysis
NFLX has shown a bearish trend recently, with significant resistance around 1180. The RSI is nearing overbought levels, and the MACD shows a potential bearish crossover. Volume has been declining, indicating weakening buying pressure.
Confidence Level
Potential Risks
Market volatility and external news could impact the prediction.
1 Week Prediction
Target: August 13, 2025$1150
$1155
$1160
$1140
Description
Expect further declines as bearish sentiment persists. The stock is likely to test support levels around 1140. The MACD remains negative, and the RSI indicates potential further downside.
Analysis
The stock has been in a bearish phase, with key support at 1140. The recent candlestick patterns suggest indecision, and the overall market sentiment is cautious. Volume spikes on down days indicate selling pressure.
Confidence Level
Potential Risks
Unexpected market news or earnings reports could lead to volatility.
1 Month Prediction
Target: September 5, 2025$1120
$1130
$1140
$1100
Description
Continued bearish momentum may push the stock lower, testing the 1100 support level. The MACD remains bearish, and the RSI indicates oversold conditions, suggesting a potential bounce could occur.
Analysis
NFLX has been trending downwards, with significant resistance at 1150. The stock is approaching oversold territory, which may lead to a short-term bounce. However, the overall trend remains bearish, and external factors could influence performance.
Confidence Level
Potential Risks
Market conditions and macroeconomic factors could lead to unexpected price movements.
3 Months Prediction
Target: November 5, 2025$1200
$1180
$1250
$1150
Description
Potential recovery as the stock may find support and bounce back. If the market sentiment improves, we could see a rally towards 1200. Watch for bullish reversal patterns and increased volume.
Analysis
While the short-term outlook is bearish, a longer-term recovery could be possible if the stock finds support around 1150. The MACD may turn bullish, and if volume increases, it could signal a reversal. However, macroeconomic factors remain a concern.
Confidence Level
Potential Risks
Economic conditions and earnings reports could significantly impact the stock's recovery.