NFLX Trading Predictions
1 Day Prediction
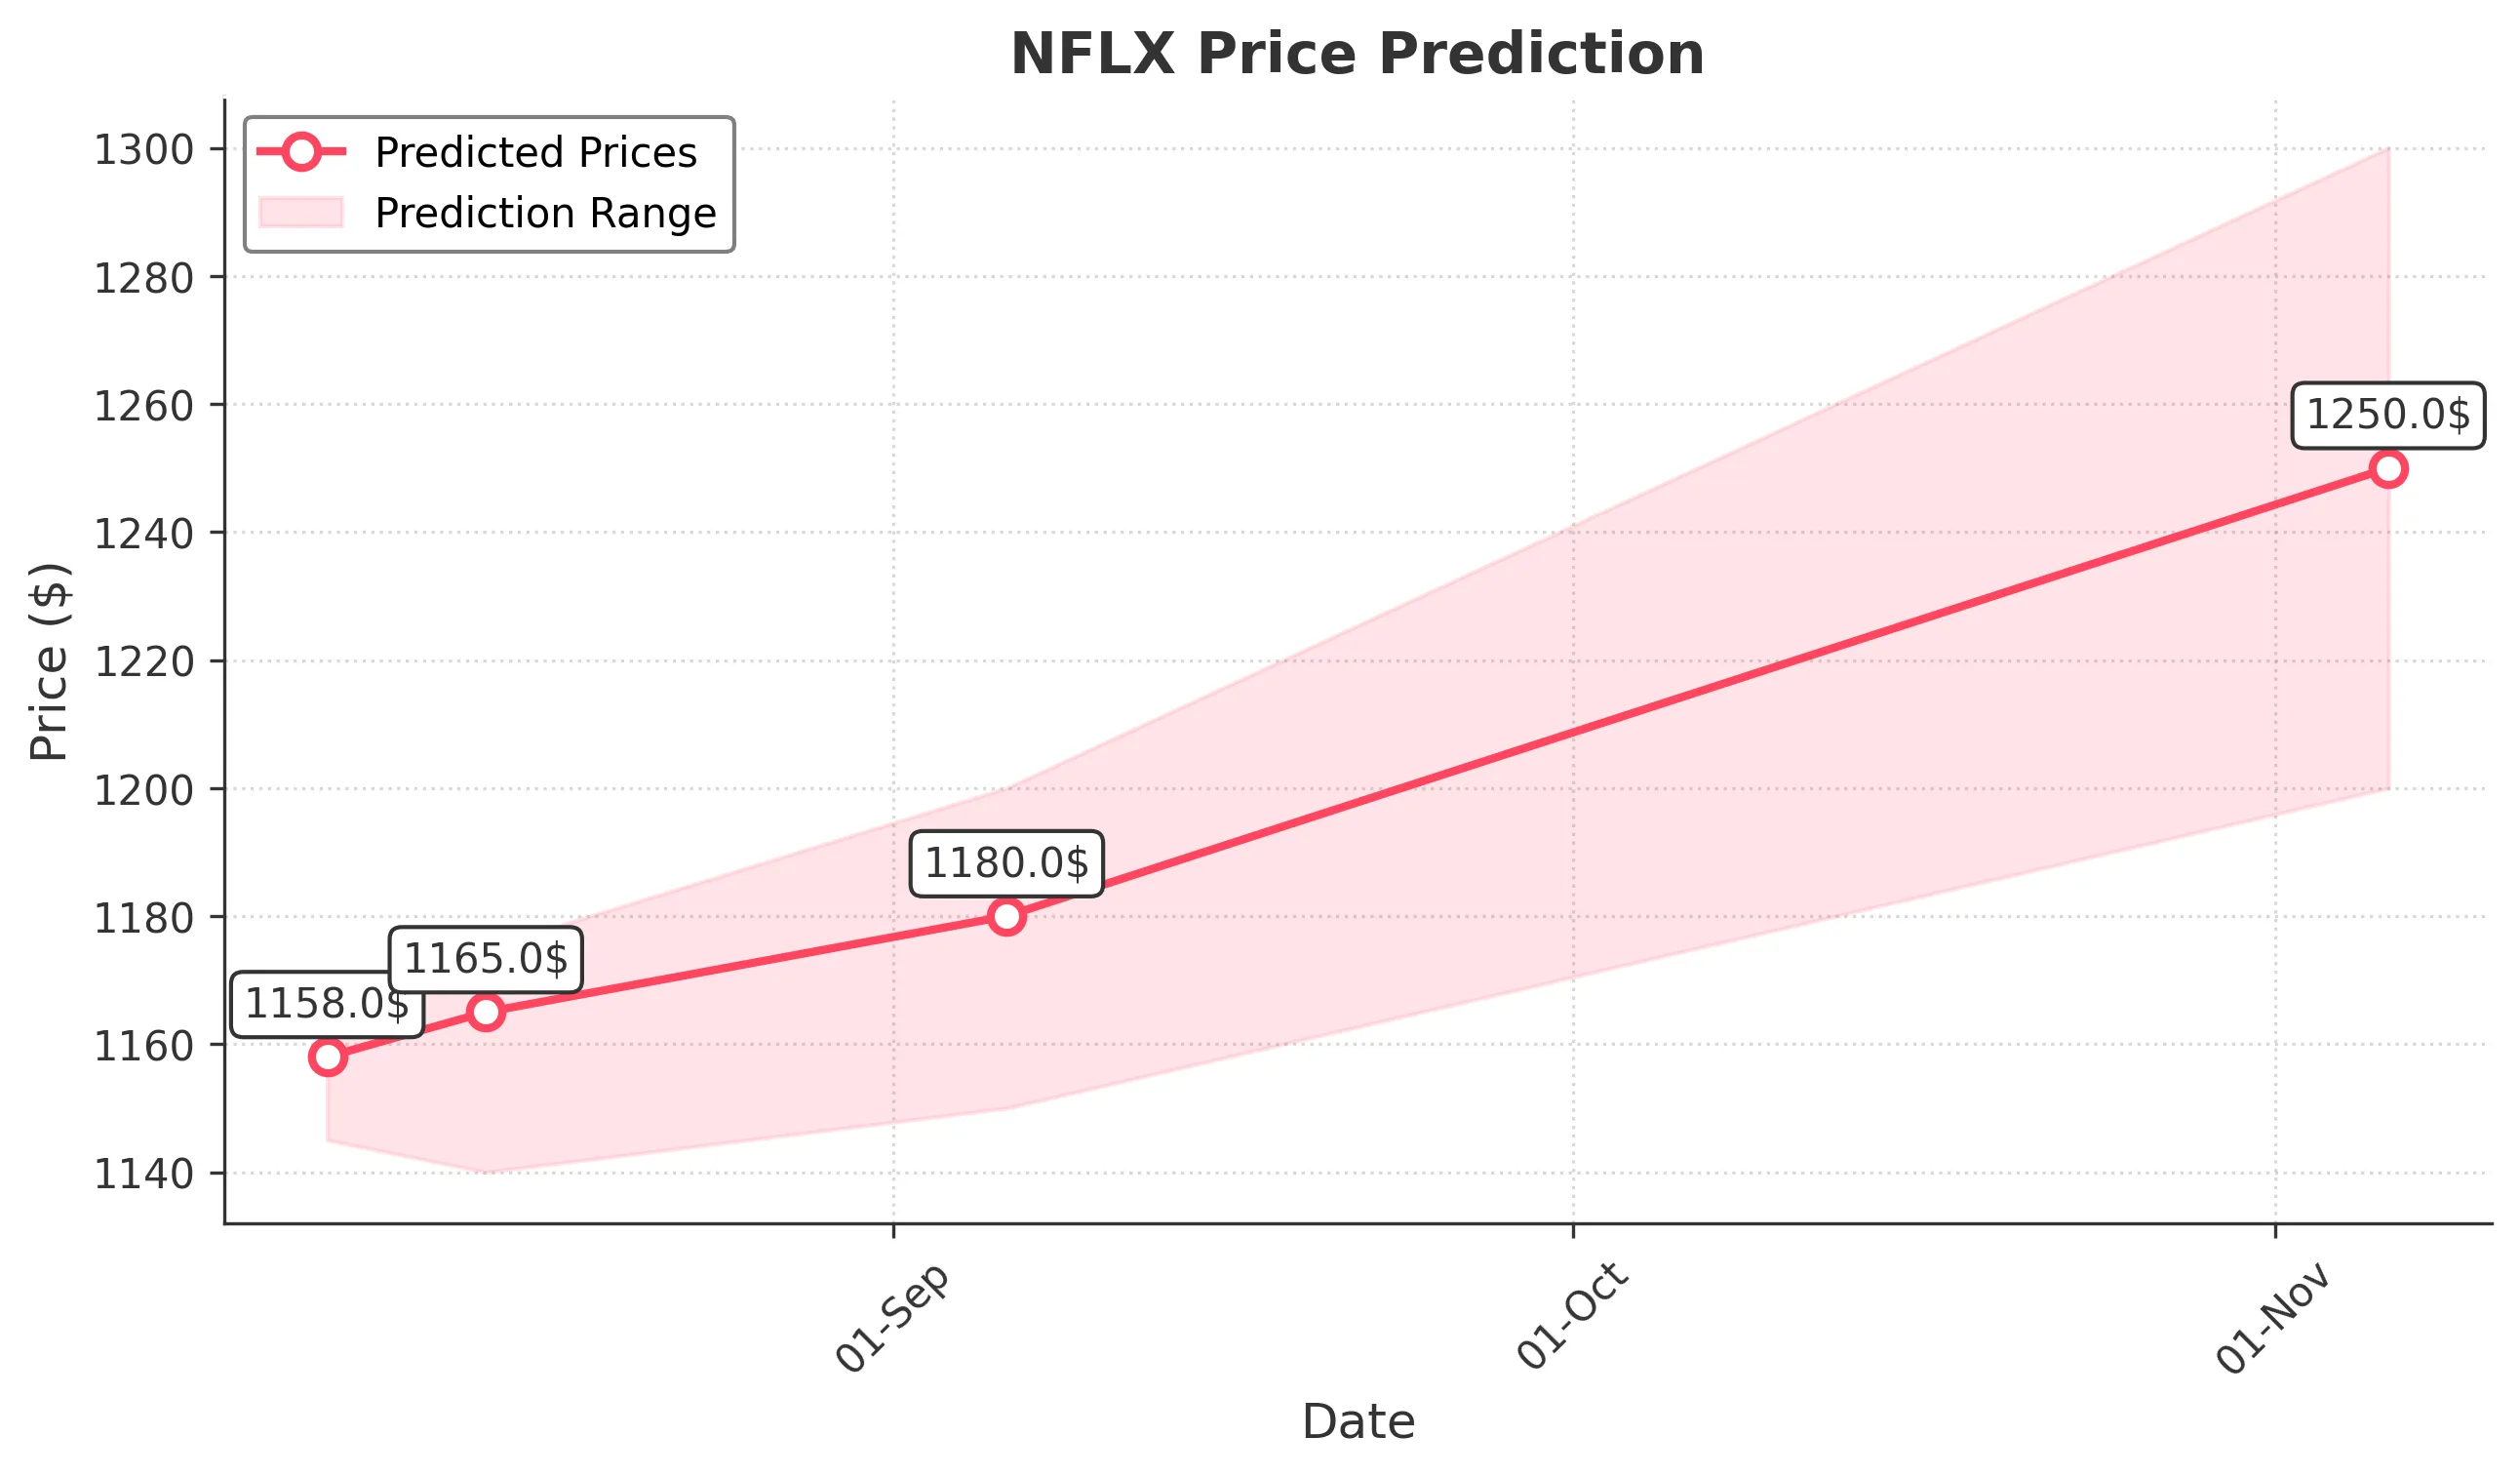
Target: August 7, 2025$1158
$1155
$1165
$1145
Description
The stock shows a slight bullish trend with a potential close around 1158. The RSI indicates neutrality, while the MACD is showing a bullish crossover. However, recent volatility suggests caution.
Analysis
Over the past 3 months, NFLX has shown a bearish trend recently, with significant support at 1150. The RSI is neutral, and MACD indicates potential bullish momentum. Volume has been inconsistent, suggesting uncertainty.
Confidence Level
Potential Risks
Market sentiment could shift due to external news or earnings reports, which may impact the price.
1 Week Prediction
Target: August 14, 2025$1165
$1158
$1175
$1140
Description
Expect a slight recovery with a close around 1165. The Bollinger Bands suggest a potential breakout, while the MACD remains bullish. However, the recent bearish trend raises concerns.
Analysis
The stock has faced downward pressure recently, with resistance at 1180. The ATR indicates increased volatility, and the recent candlestick patterns show indecision. Overall, the outlook remains cautious.
Confidence Level
Potential Risks
Potential for further declines if market sentiment turns negative or if earnings disappoint.
1 Month Prediction
Target: September 6, 2025$1180
$1165
$1200
$1150
Description
A potential recovery to 1180 is expected as the stock stabilizes. The Fibonacci retracement levels suggest support at 1150, while the MACD indicates a bullish trend. Caution is advised due to market volatility.
Analysis
NFLX has shown a bearish trend recently, with key support at 1150. The RSI is approaching oversold levels, indicating a potential rebound. Volume patterns suggest cautious trading, and external factors may influence future performance.
Confidence Level
Potential Risks
Economic factors or earnings reports could lead to unexpected volatility.
3 Months Prediction
Target: November 6, 2025$1250
$1180
$1300
$1200
Description
A bullish outlook with a potential close of 1250 as the stock recovers. The MACD shows a strong bullish signal, and the RSI is improving. However, external market conditions could impact this prediction.
Analysis
The stock has been volatile, with a recent bearish trend. Key resistance is at 1300, while support is at 1200. The MACD and RSI suggest potential recovery, but market sentiment remains a concern.
Confidence Level
Potential Risks
Macroeconomic factors or competitive pressures could affect the stock's performance.